- Advertisement -
Explore California’s population density map, which shows county-level demographics, population density, historical census data from 1850 to 2023 and voting distribution across the state. Discover trends in California’s growth and its place on the US map through detailed graphs and insights into historical change and diversity.
Population Map of California
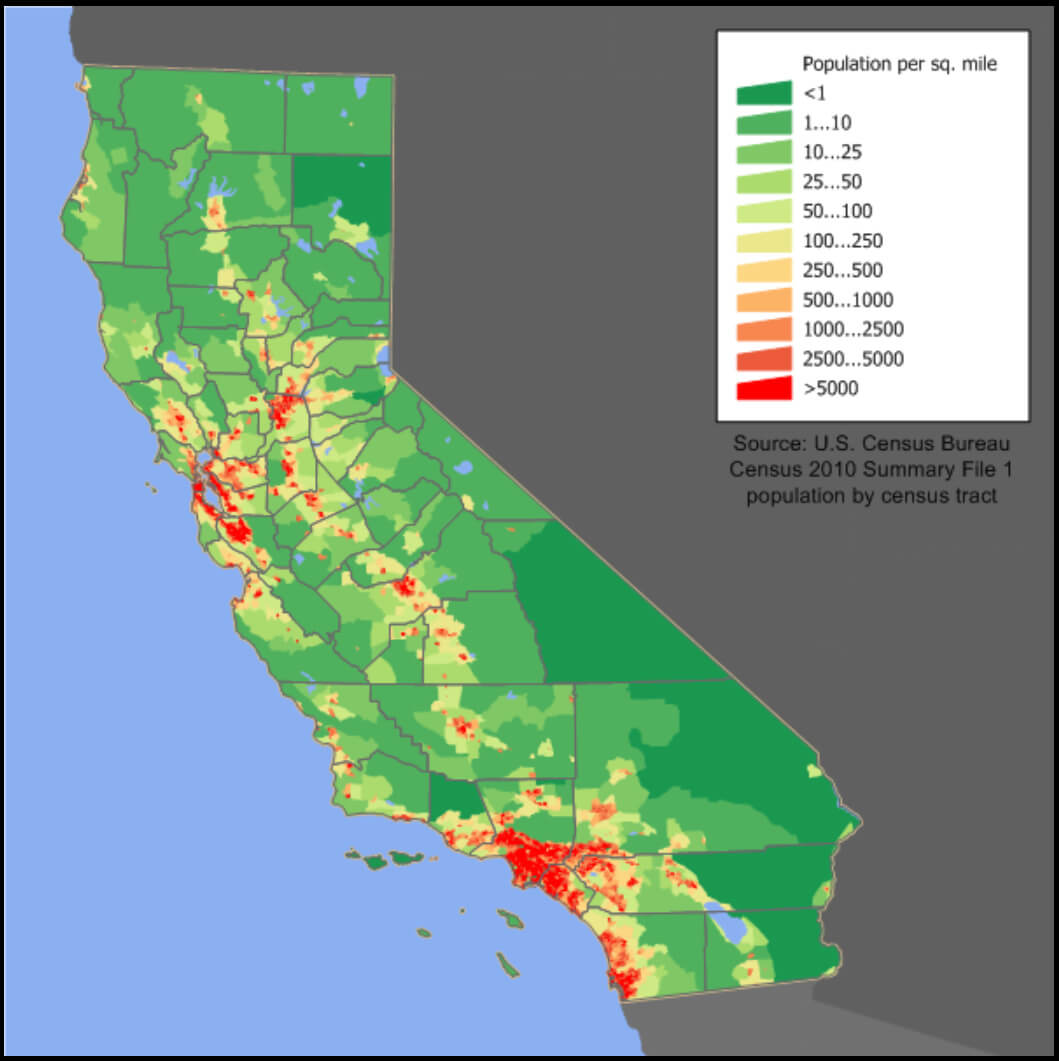
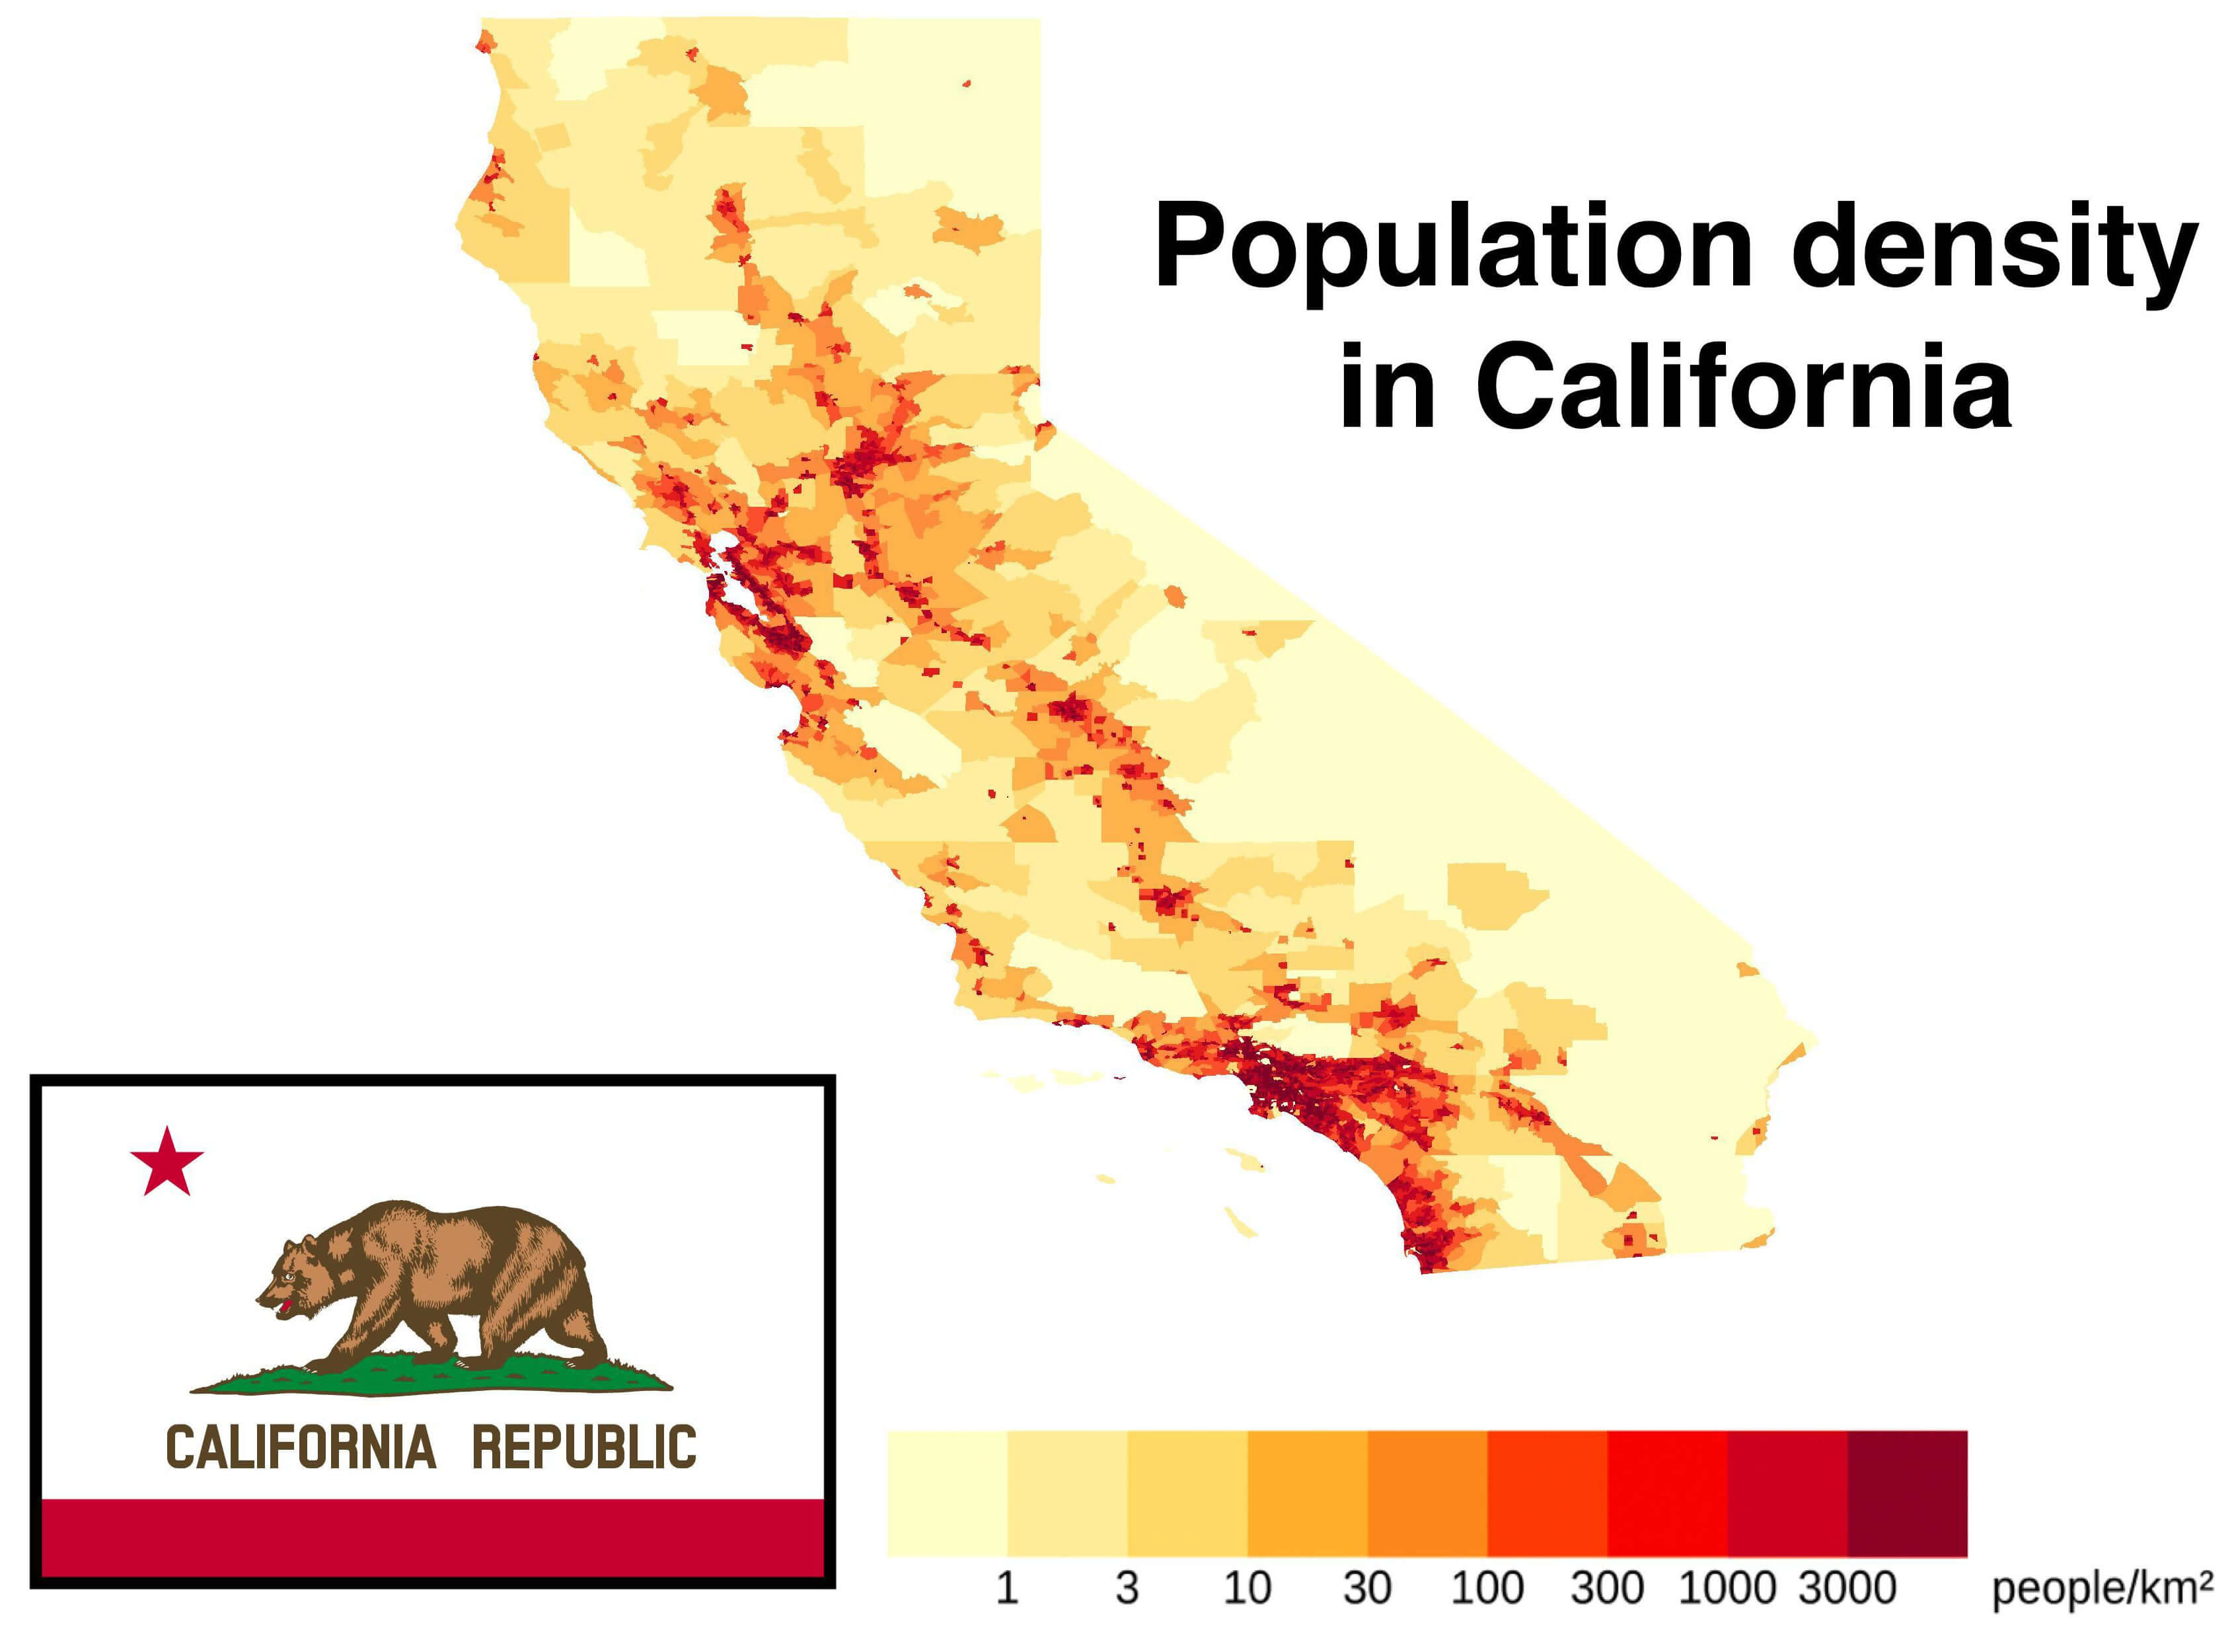
California Population Density Map
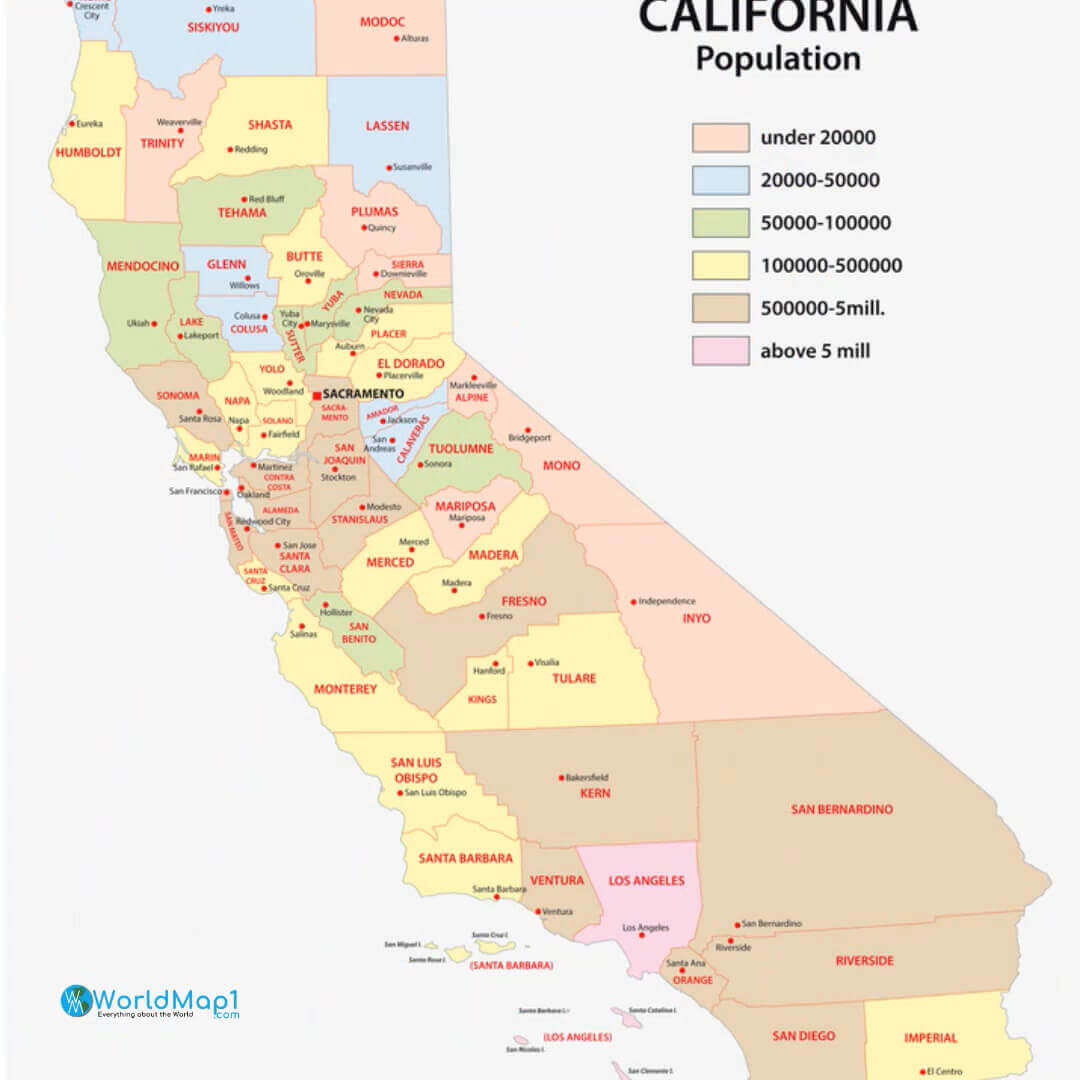
California Population Map by County
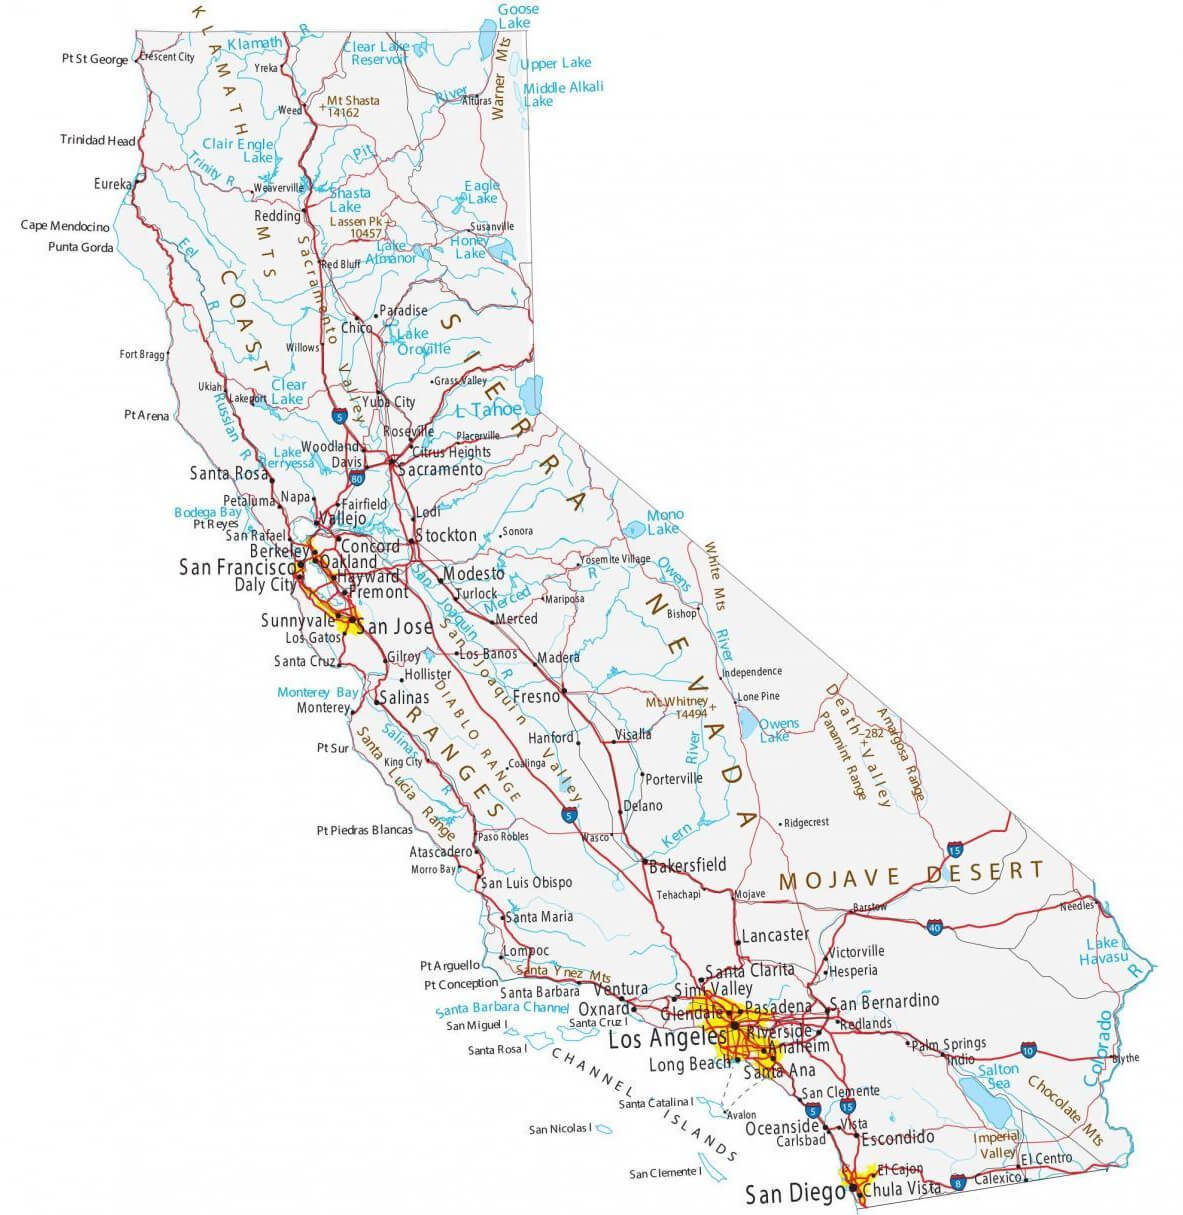
Physical Map of California with Cities and Population
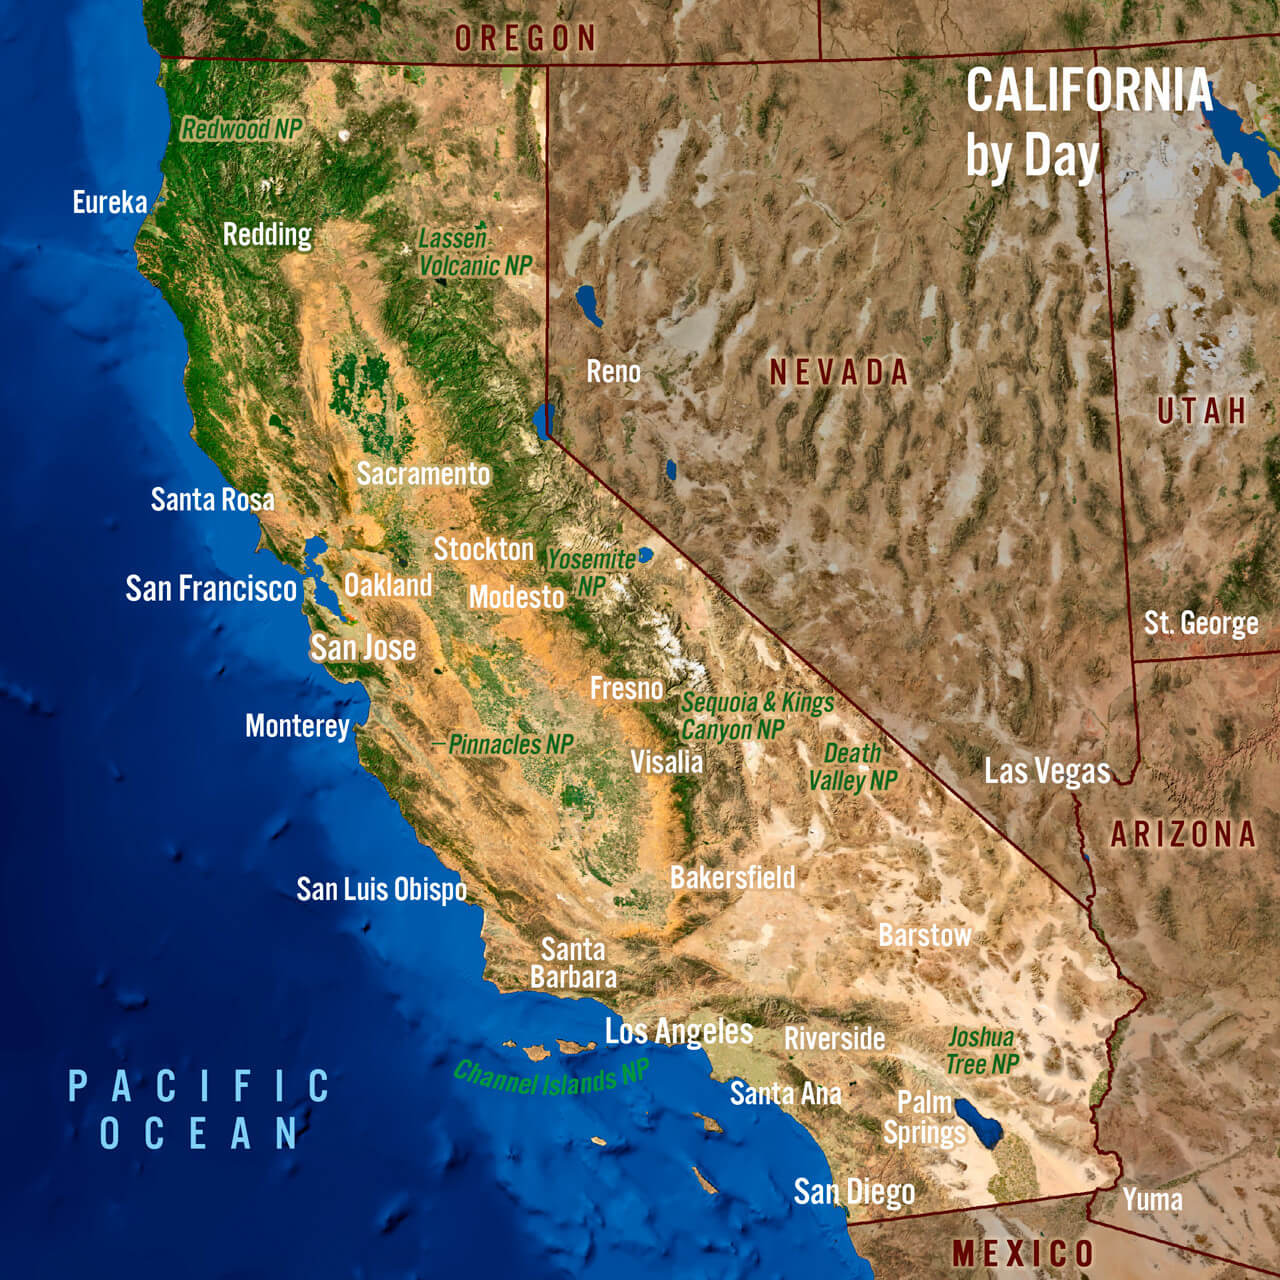 Physical map of California with cities and population details, showing key locations.
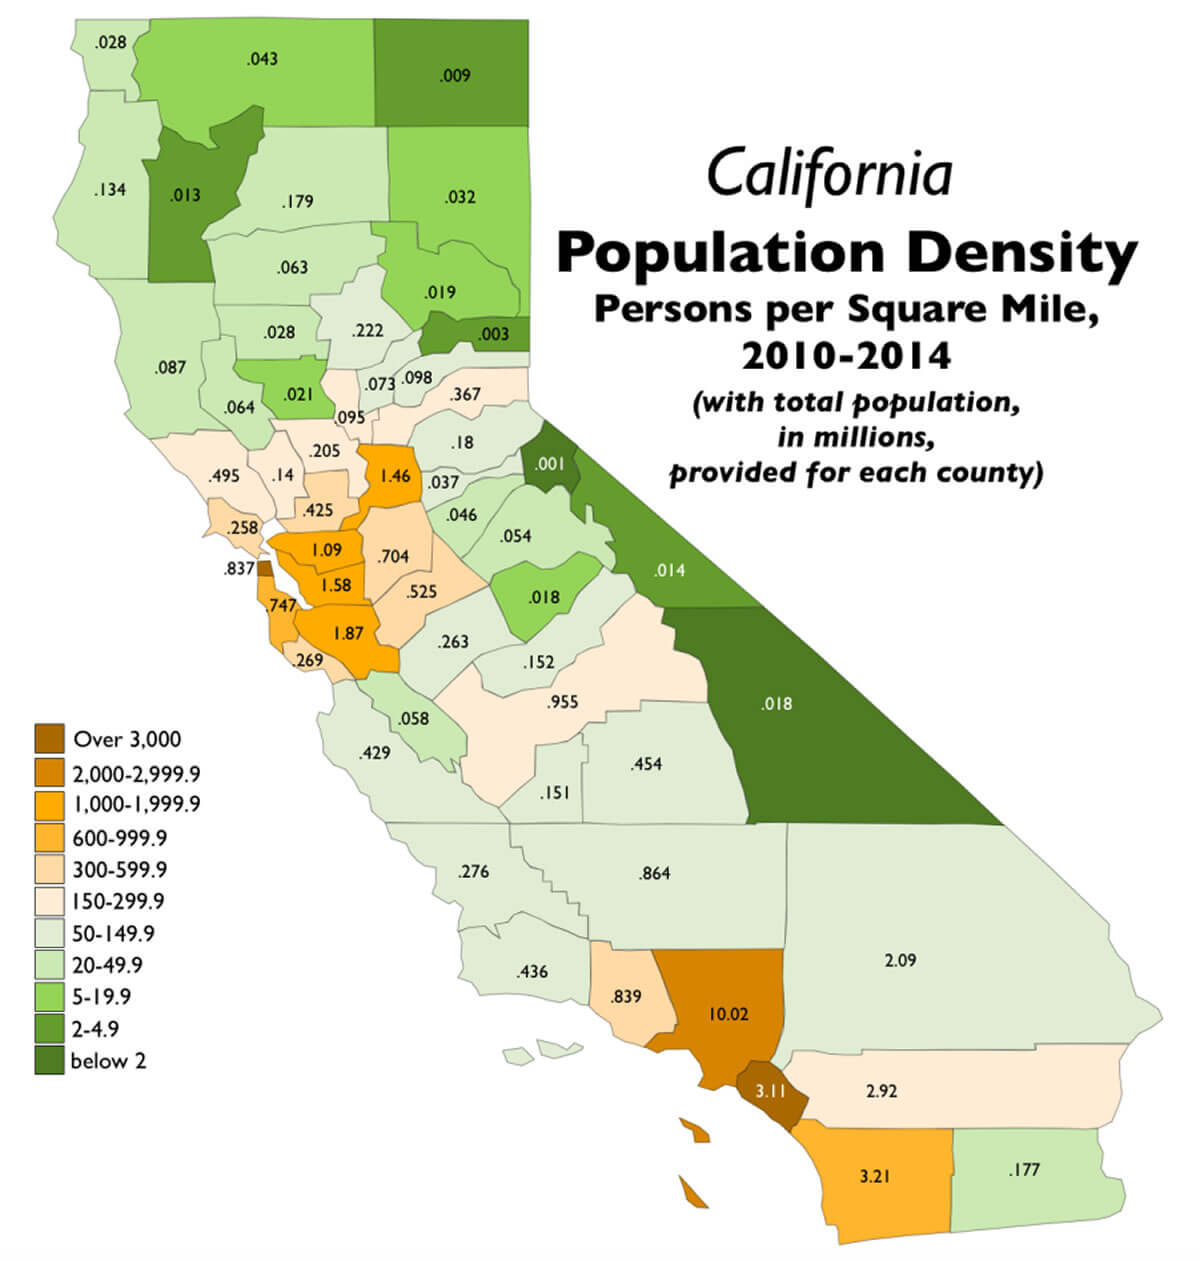
Population density map of California
Religion in California (2014)
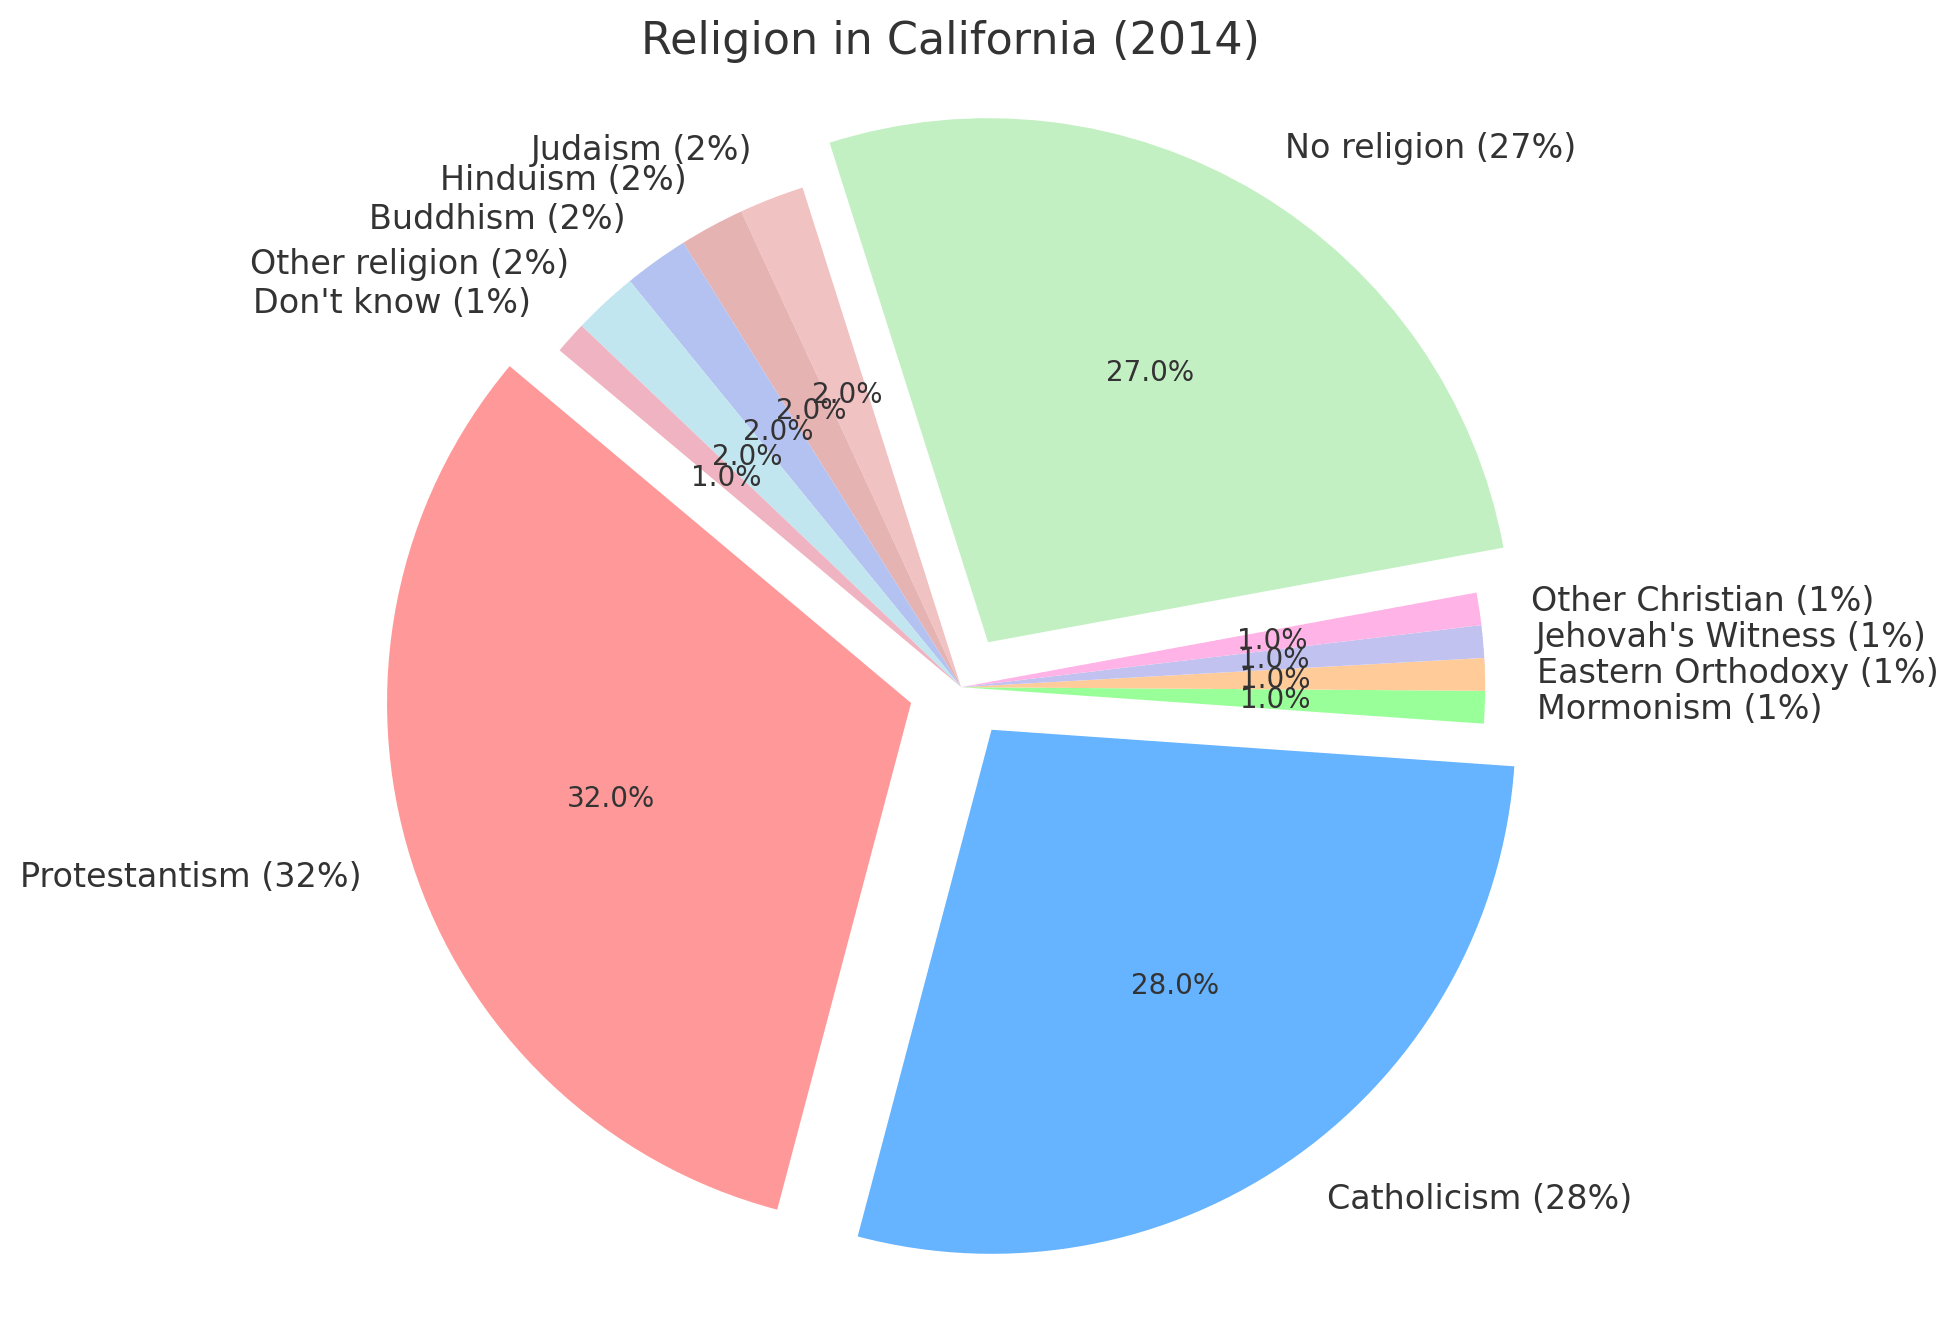 Religion in California, United States in 2014
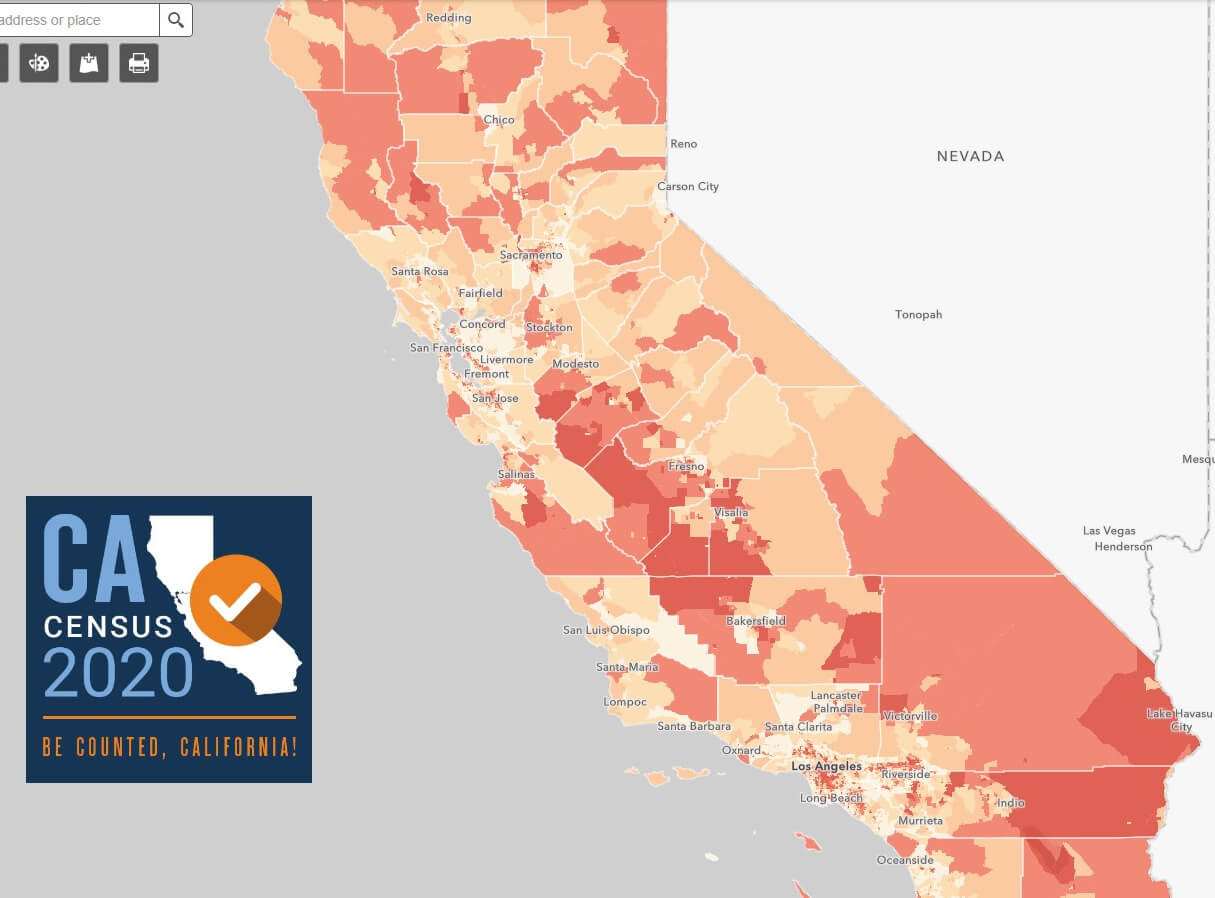
California 2020 census map by counties
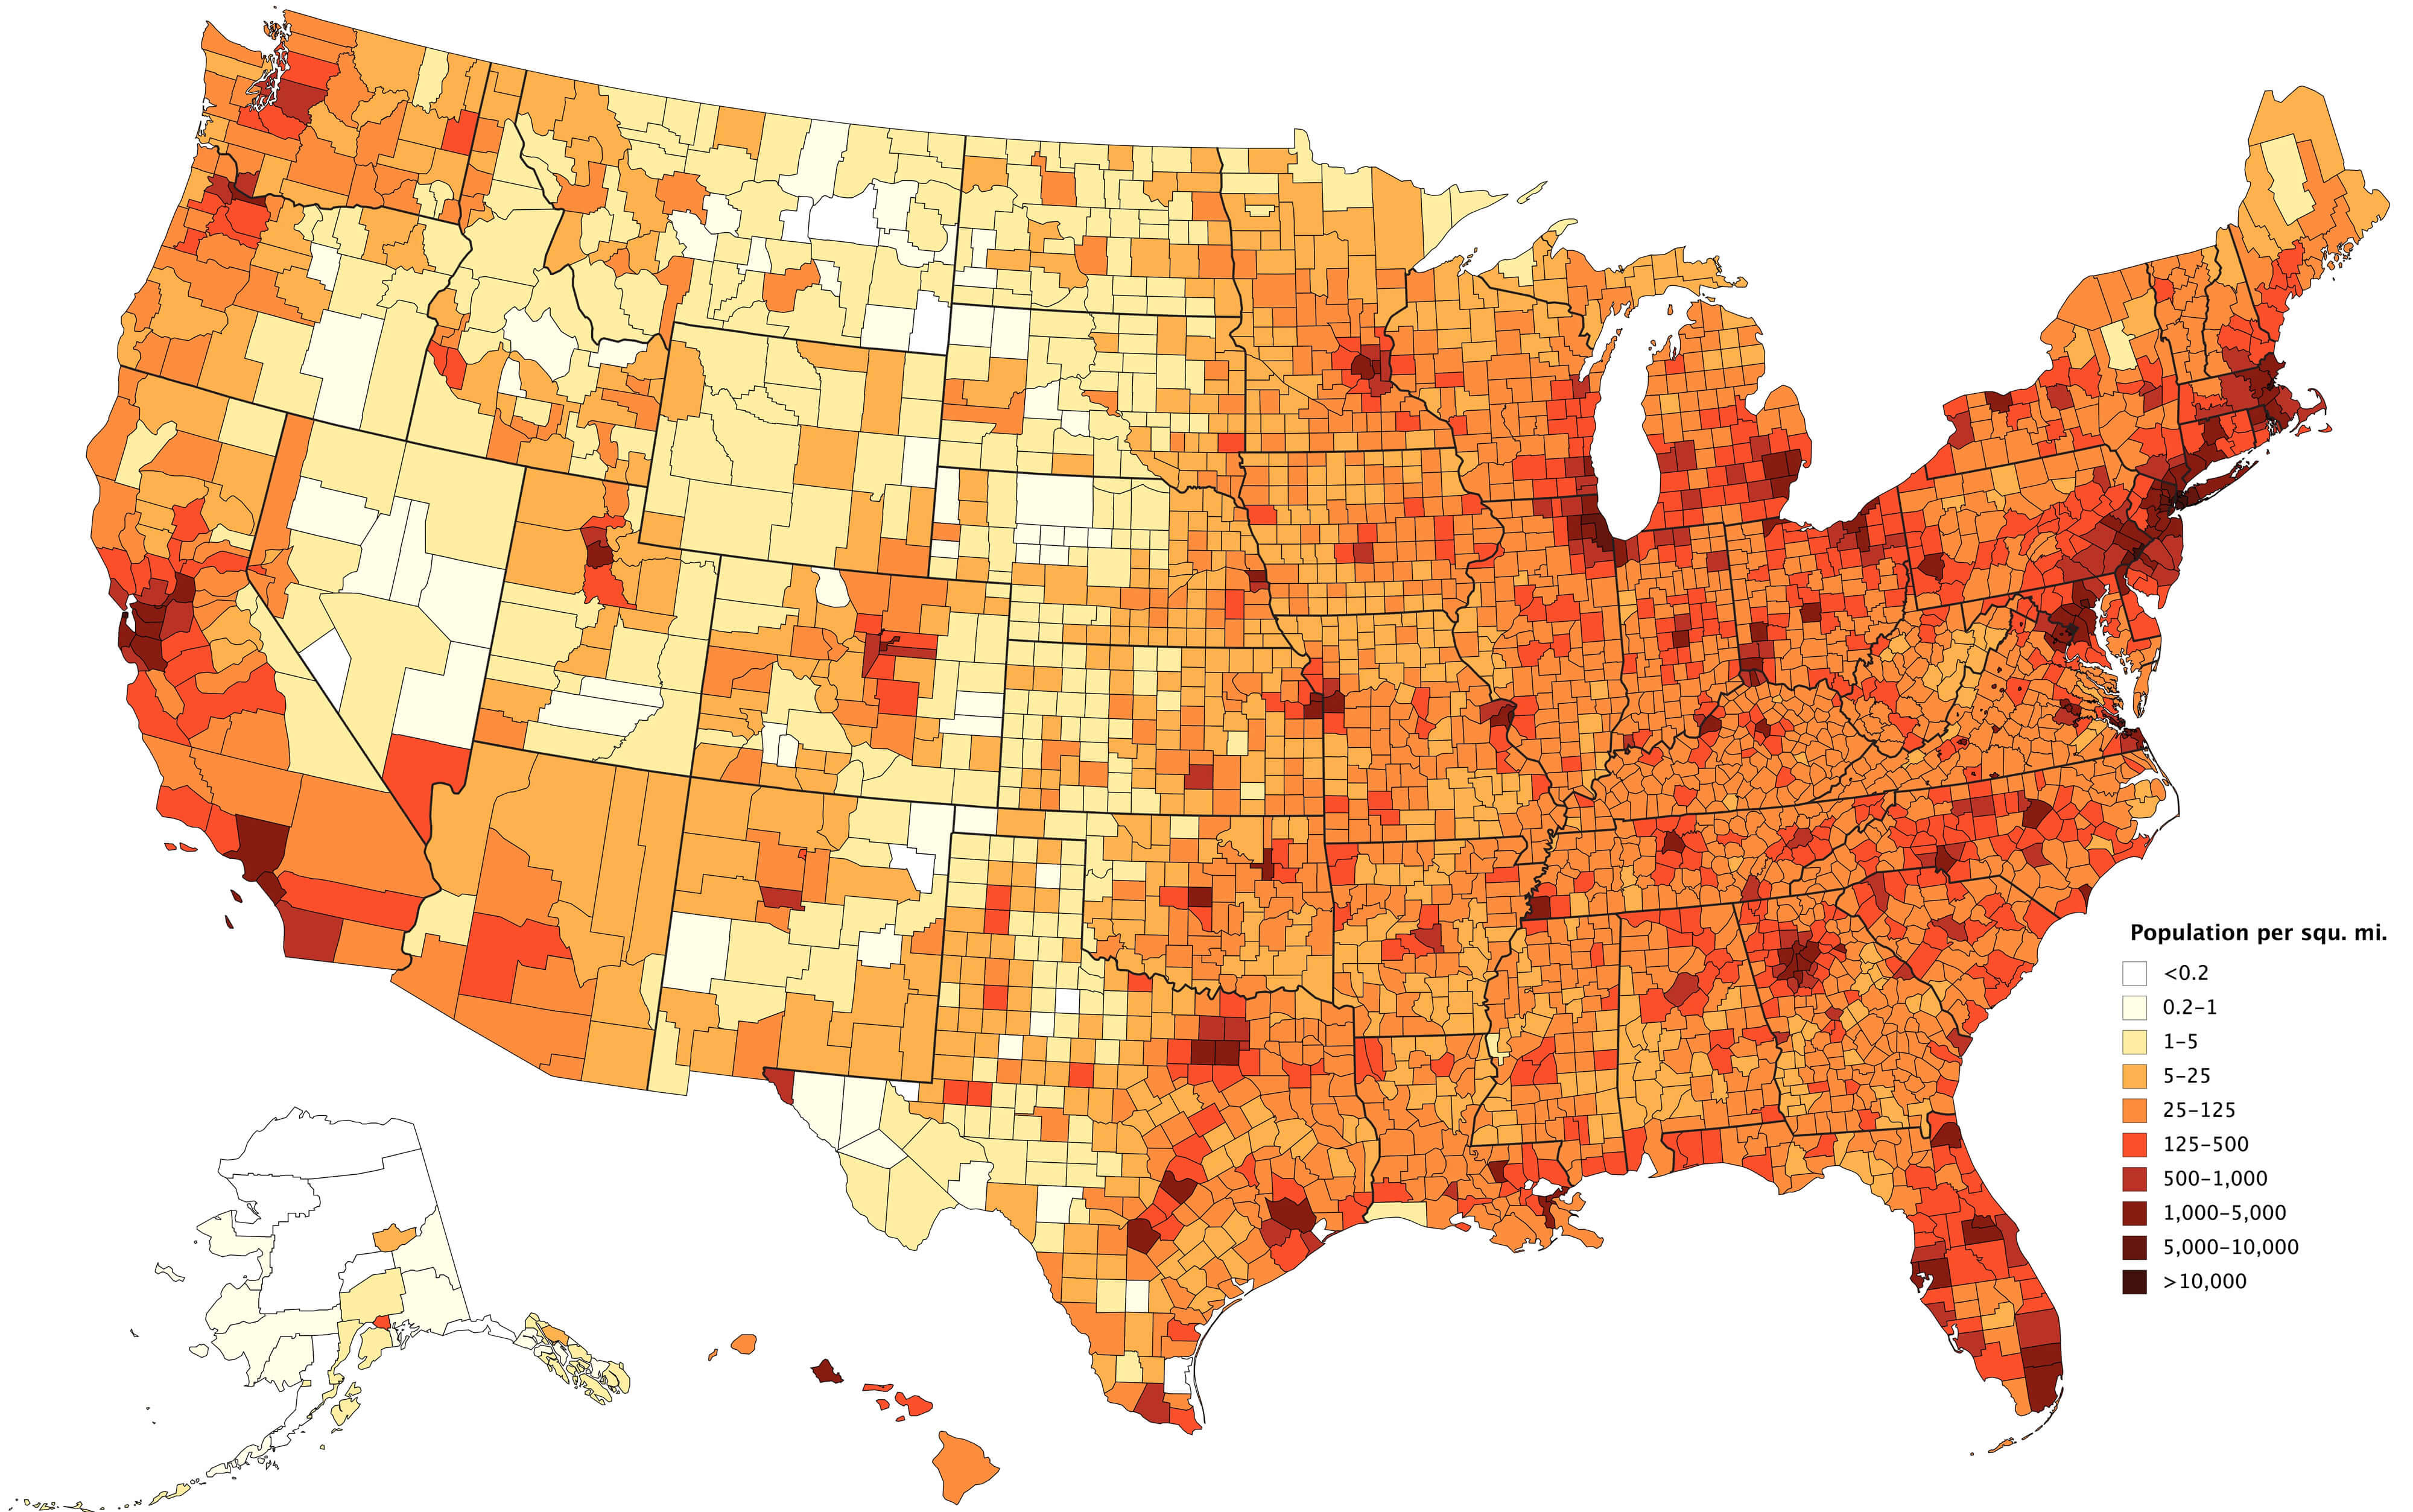
California and the united states population density map

California and the US population density map

California cities map with populated cities
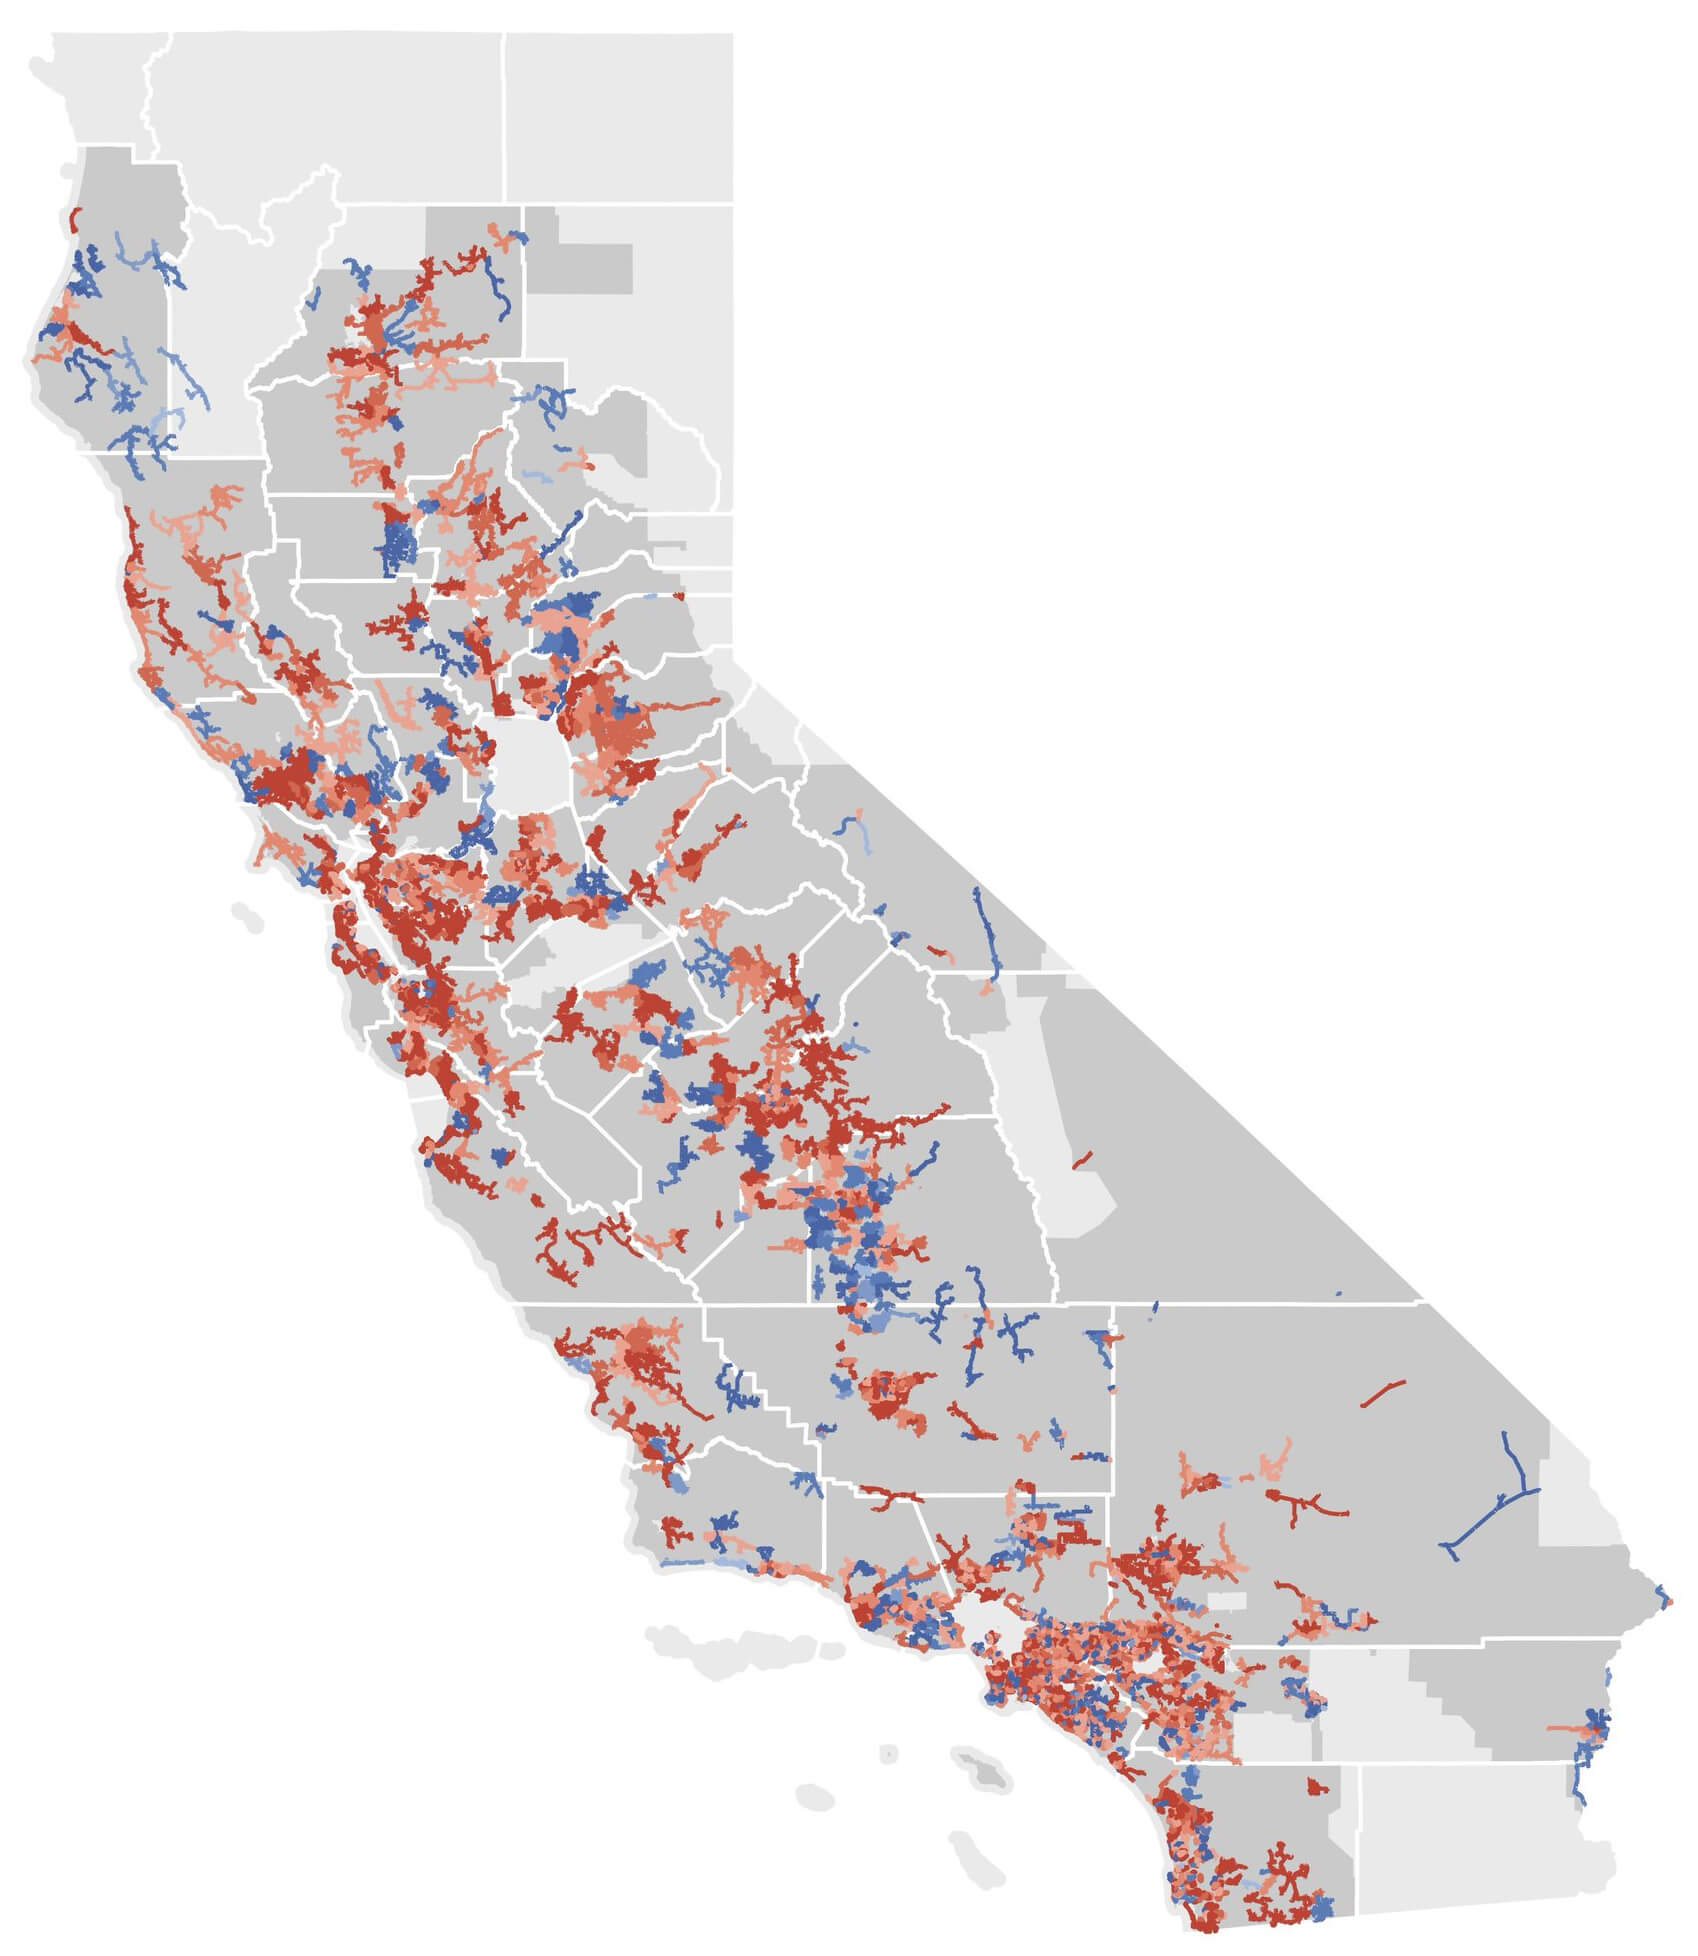
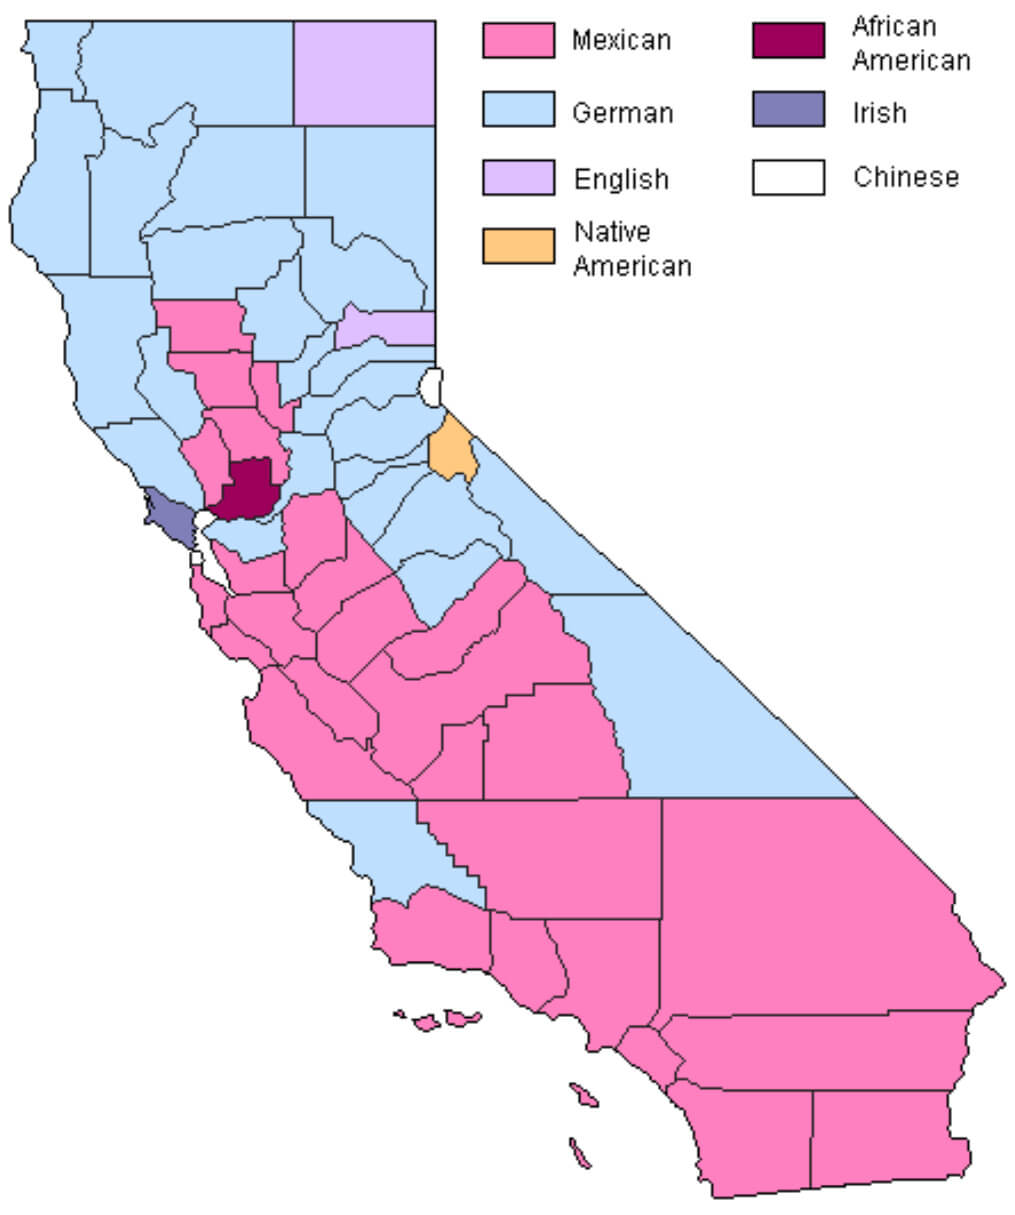
California counties ancestry map

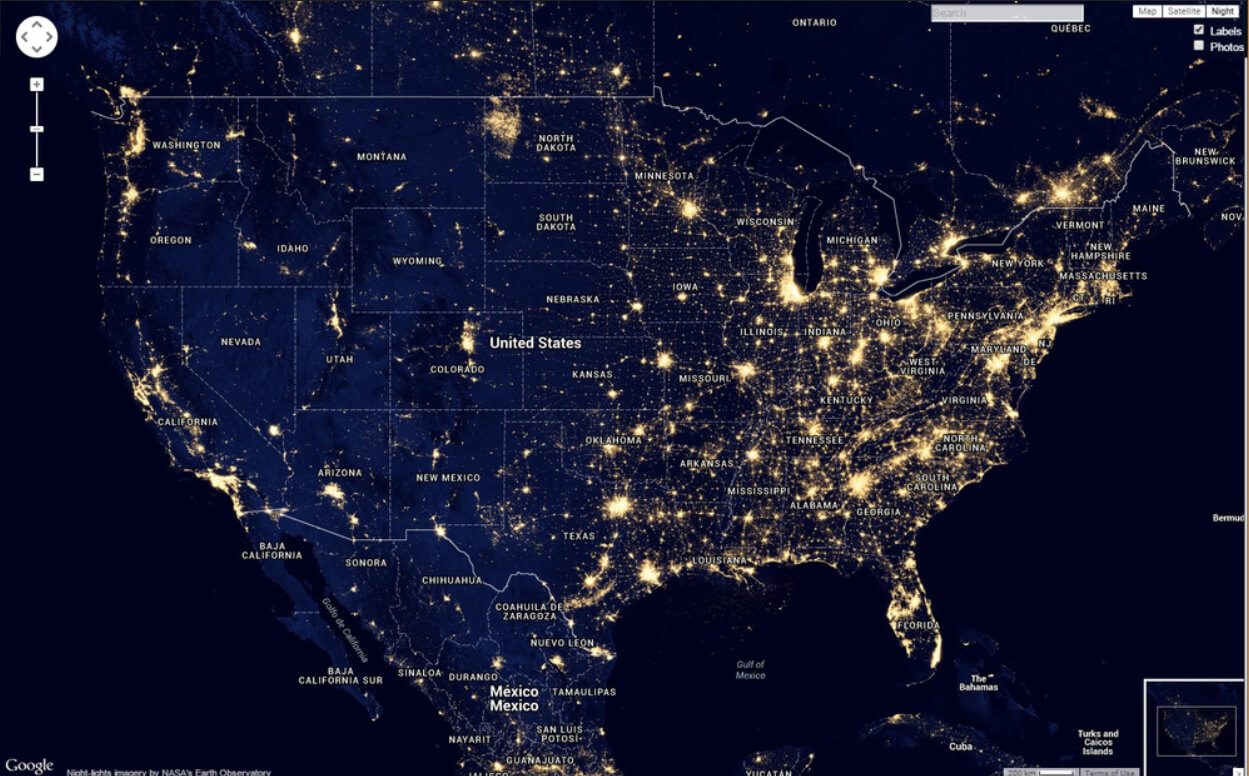
California population density map at night

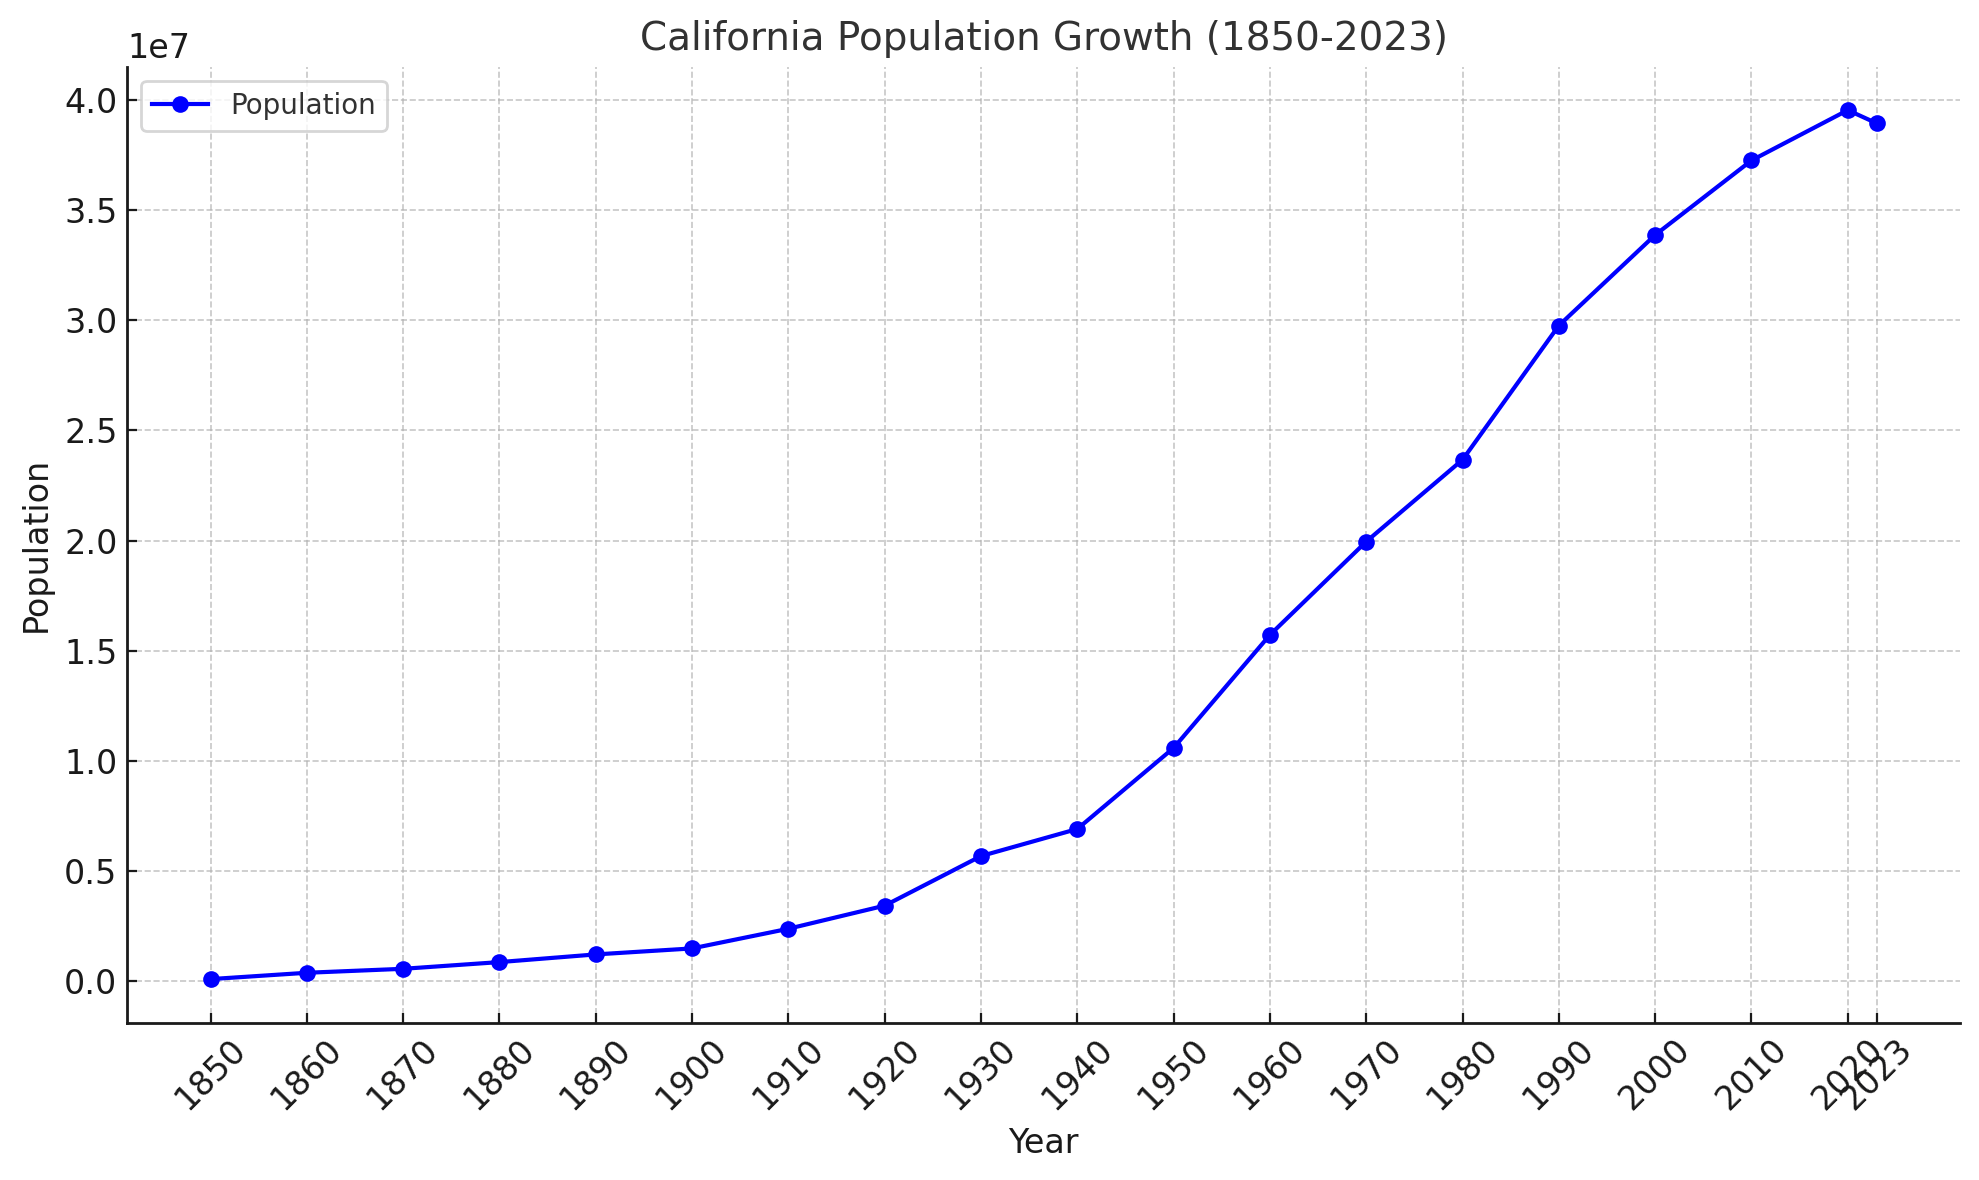
California Population Growth (1850-2023)
 California Population Growth (1850-2023)
Here is the line chart depicting California’s population growth from 1850 to 2023. Let me know if you need any adjustments or further visualizations.
California population map

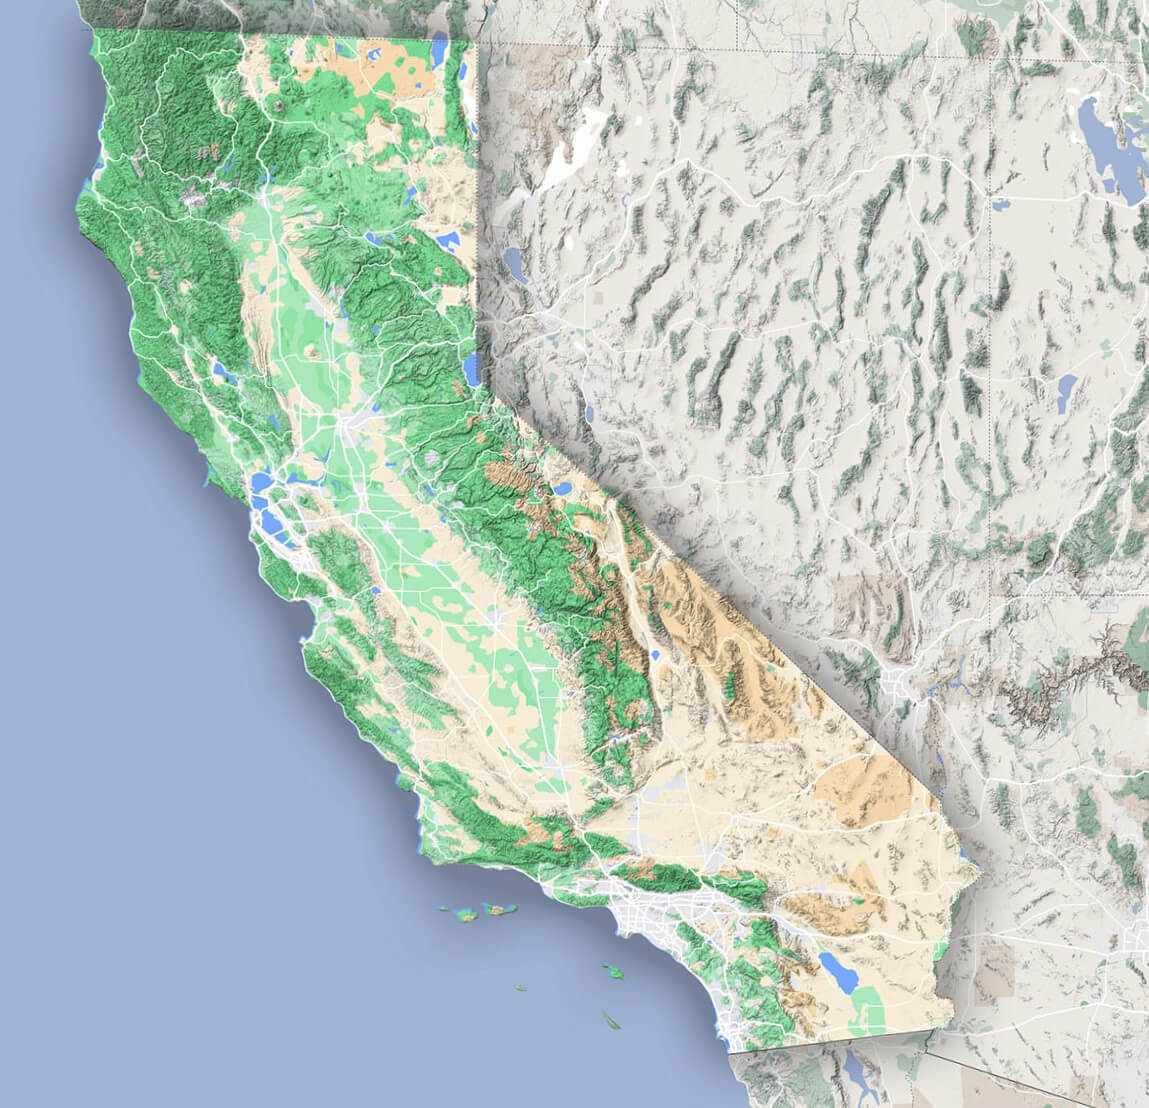
California population map with terrain

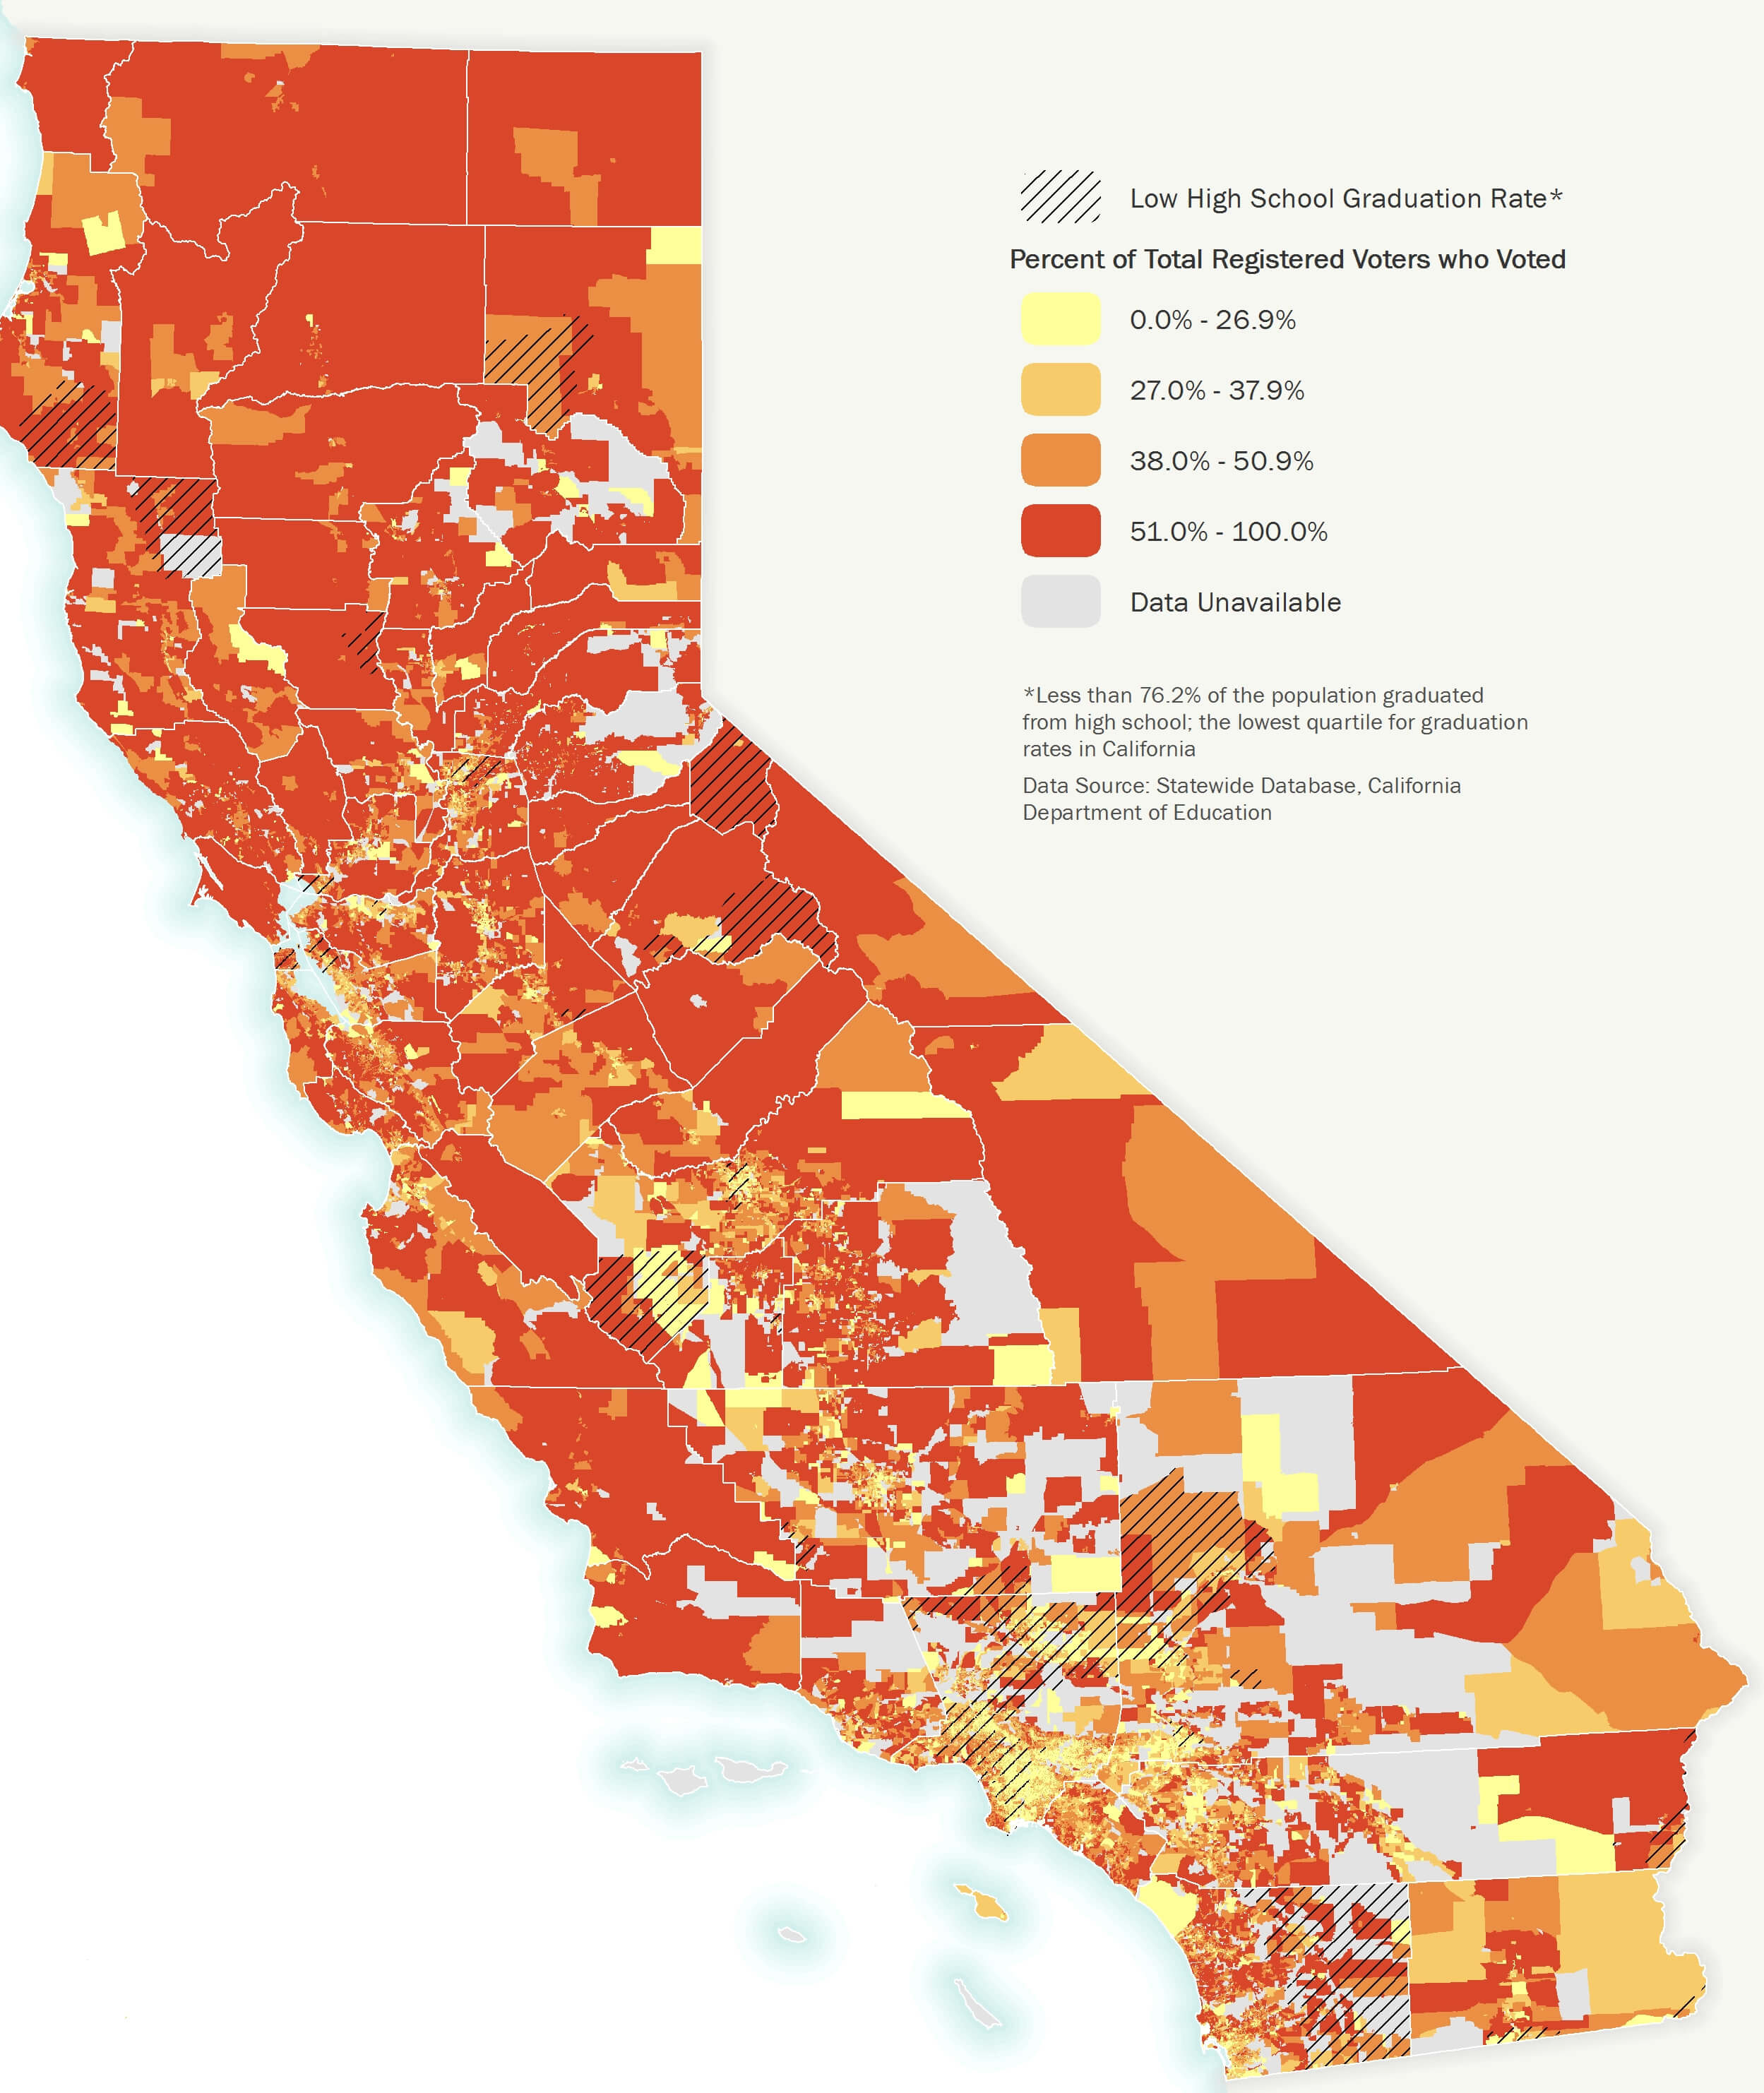
California voters map

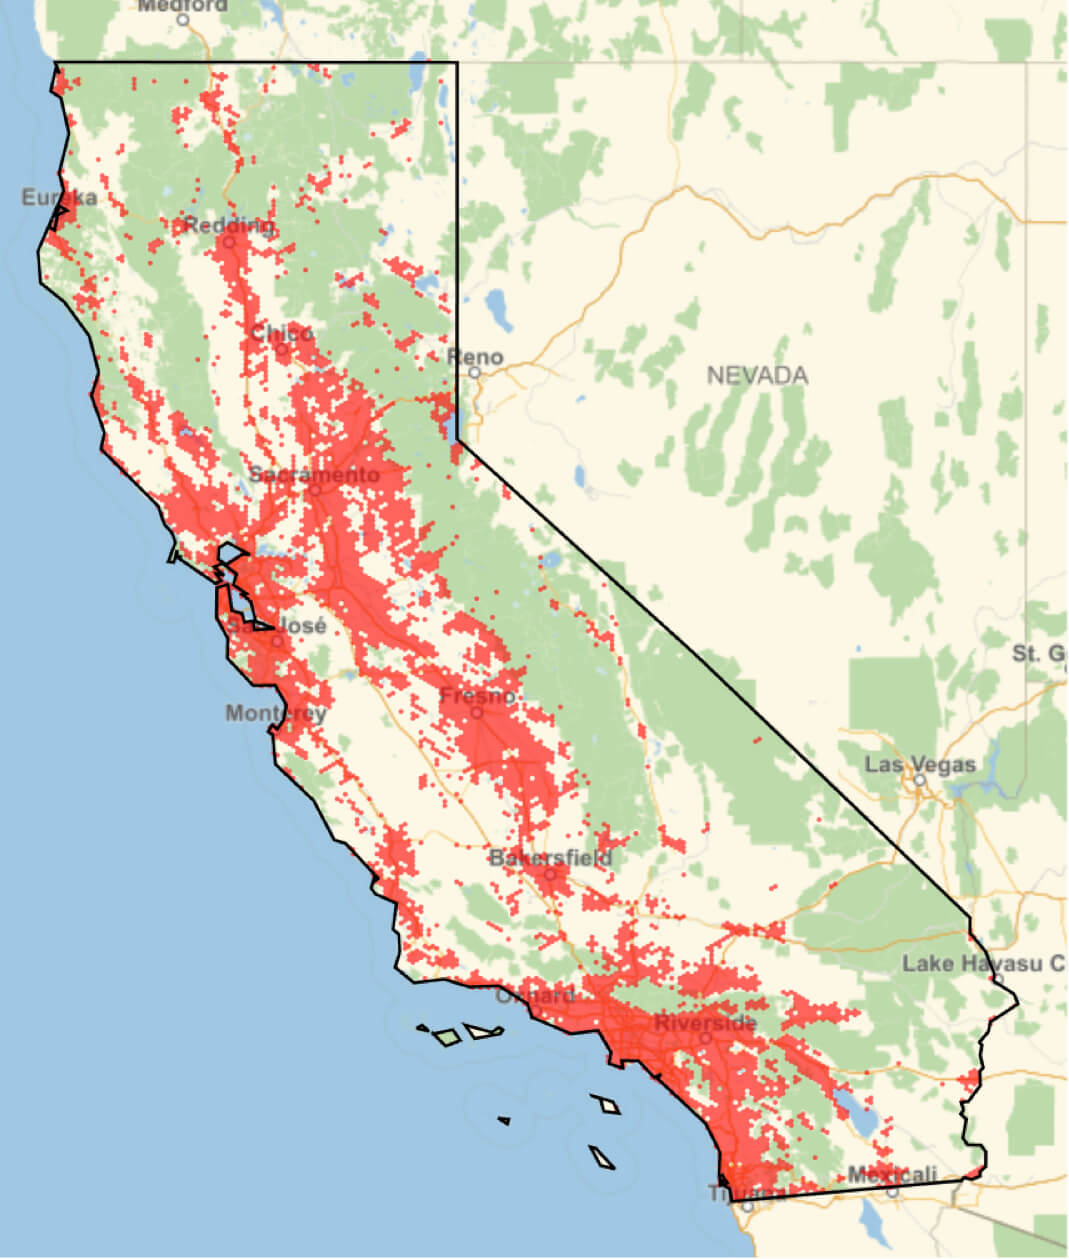
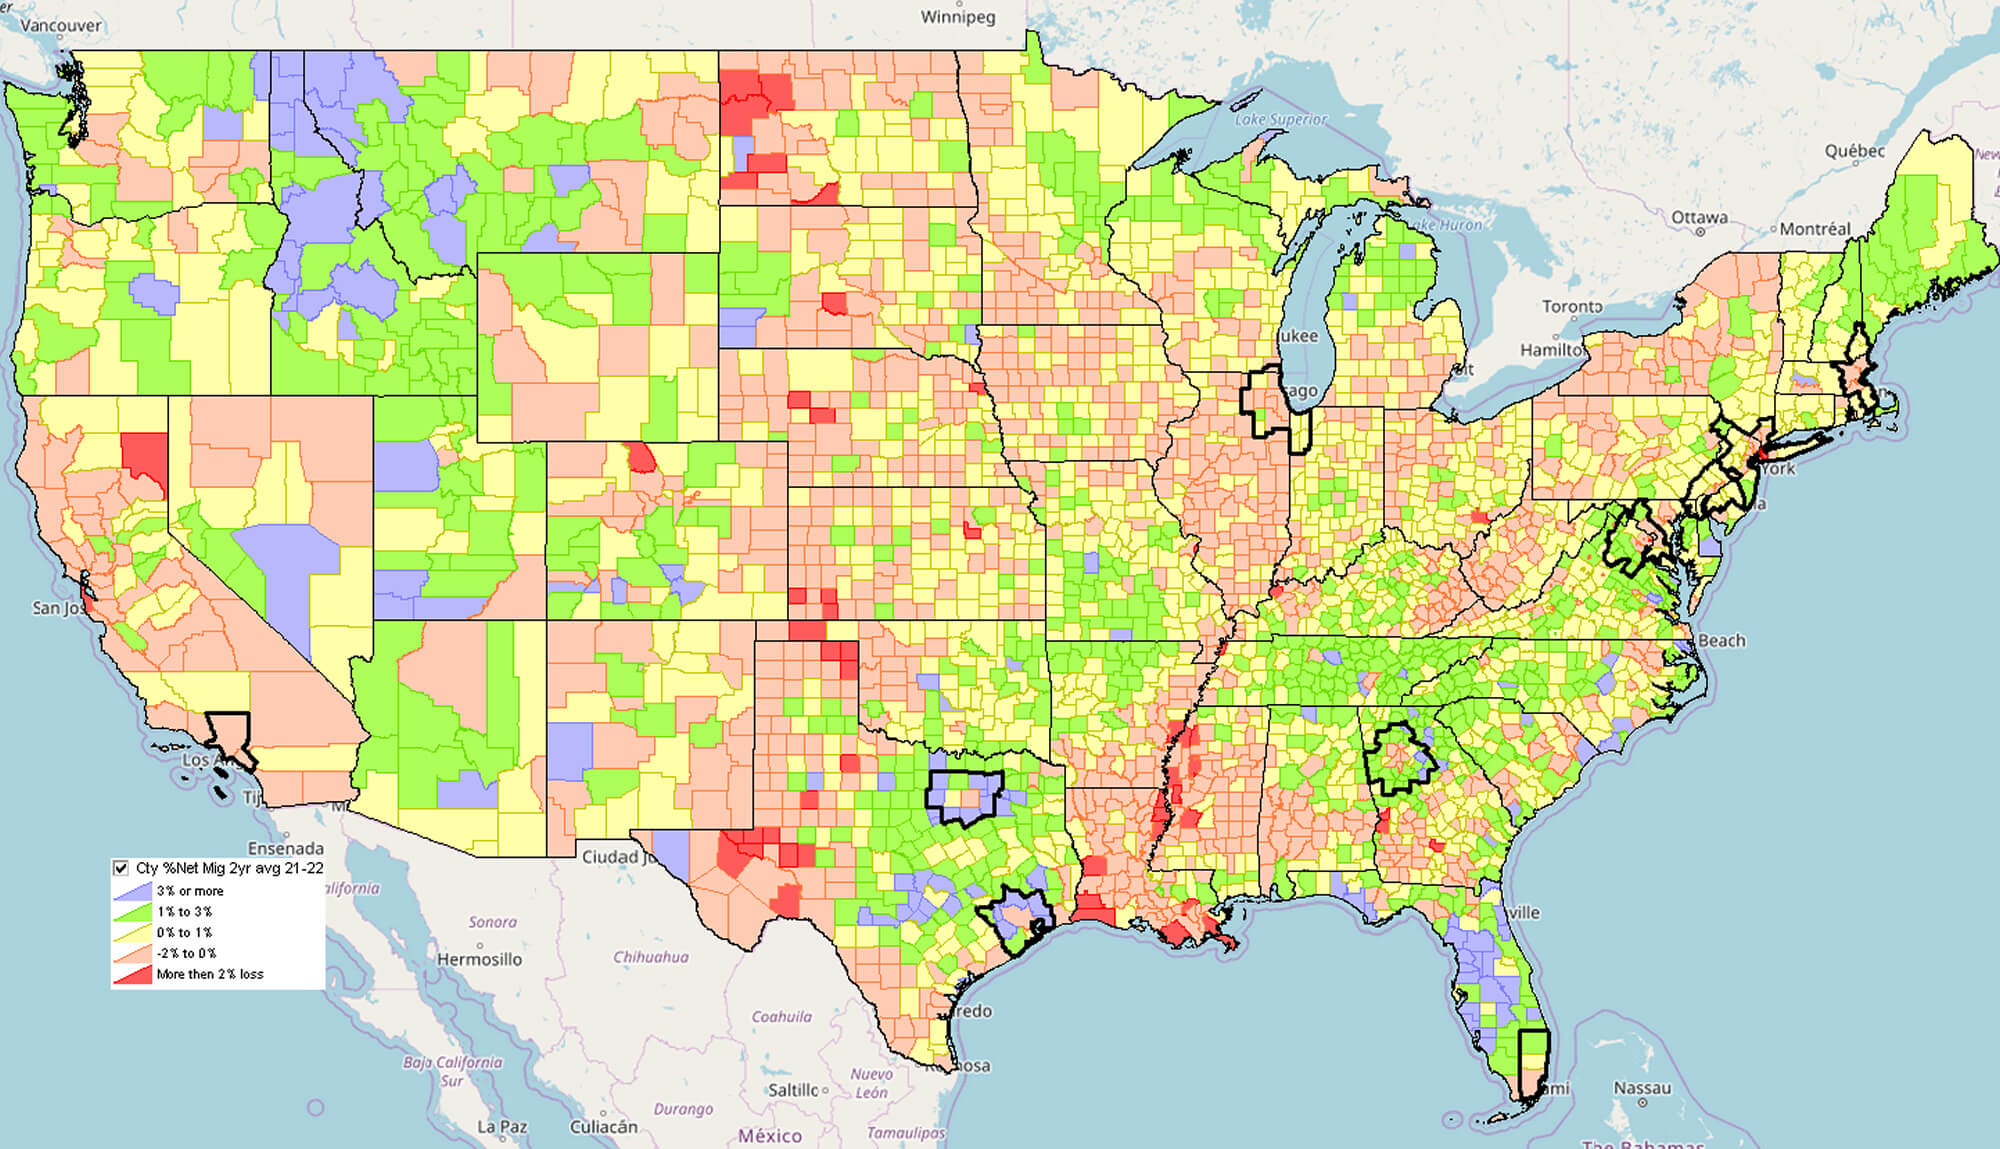
Lived area and lived population density map in California

Where is California on the United States Map?
Show Google map, satellite map, where is the country located.
Get directions by driving, walking, bicycling, public transportation and travel with street view.
Feel free to explore these pages as well:
- California Map ↗️
- Map of California↗️
- California County Map ↗️
- California Political Map ↗️
- California Physical Map ↗️
- California Cities Map ↗️
- California Road Map ↗️
- California Time Zone Map ↗️
- A Collection of California Maps ↗️
- Los Angeles Map ↗️
- LA Fires January 2025 ↗️
- Los Angeles Wildfires in Map ↗️
- Palisades Map in Los Angeles ↗️
- Malibu Map in Los Angeles ↗️
- San Fernando Map in Los Angeles ↗️
- Eaton Map in Los Angeles ↗️
- North America Earth Map ↗️
- Discovering Los Angeles ↗️
- Discover the California: A Vibrant Journey through Golden State ↗️
- Discovering Bakersfield: The Heart of California’s Central Valley ↗️
- Anaheim: California’s Hidden Gem ↗️
- Guide to Los Angeles’ Top 10 Attractions ↗️
- Discover Chula Vista: A Hidden California Gem with Rich Culture and Stunning Views ↗️
- United States Map ↗️
- Map of United States ↗️
- North America Map ↗️
- Advertisement -

 California Population Growth (1850-2023)
