- Advertisement -
In the 2024 US Presidential Election, several key swing states are predicted to play a decisive role in determining the outcome. These battlegrounds include Pennsylvania, Michigan, North Carolina, Georgia, Arizona, Wisconsin, and Nevada. Each of these states has a history of swinging between Democratic and Republican preferences, often by razor-thin margins, making them crucial in close elections.
Candidates from both major parties are likely to focus considerable attention and resources on these regions, as victories in even a few of these states could tip the scales in the Electoral College. The dynamics in these swing states will be closely watched as they reflect the nation’s broader political landscape and could ultimately decide the next President of the United States.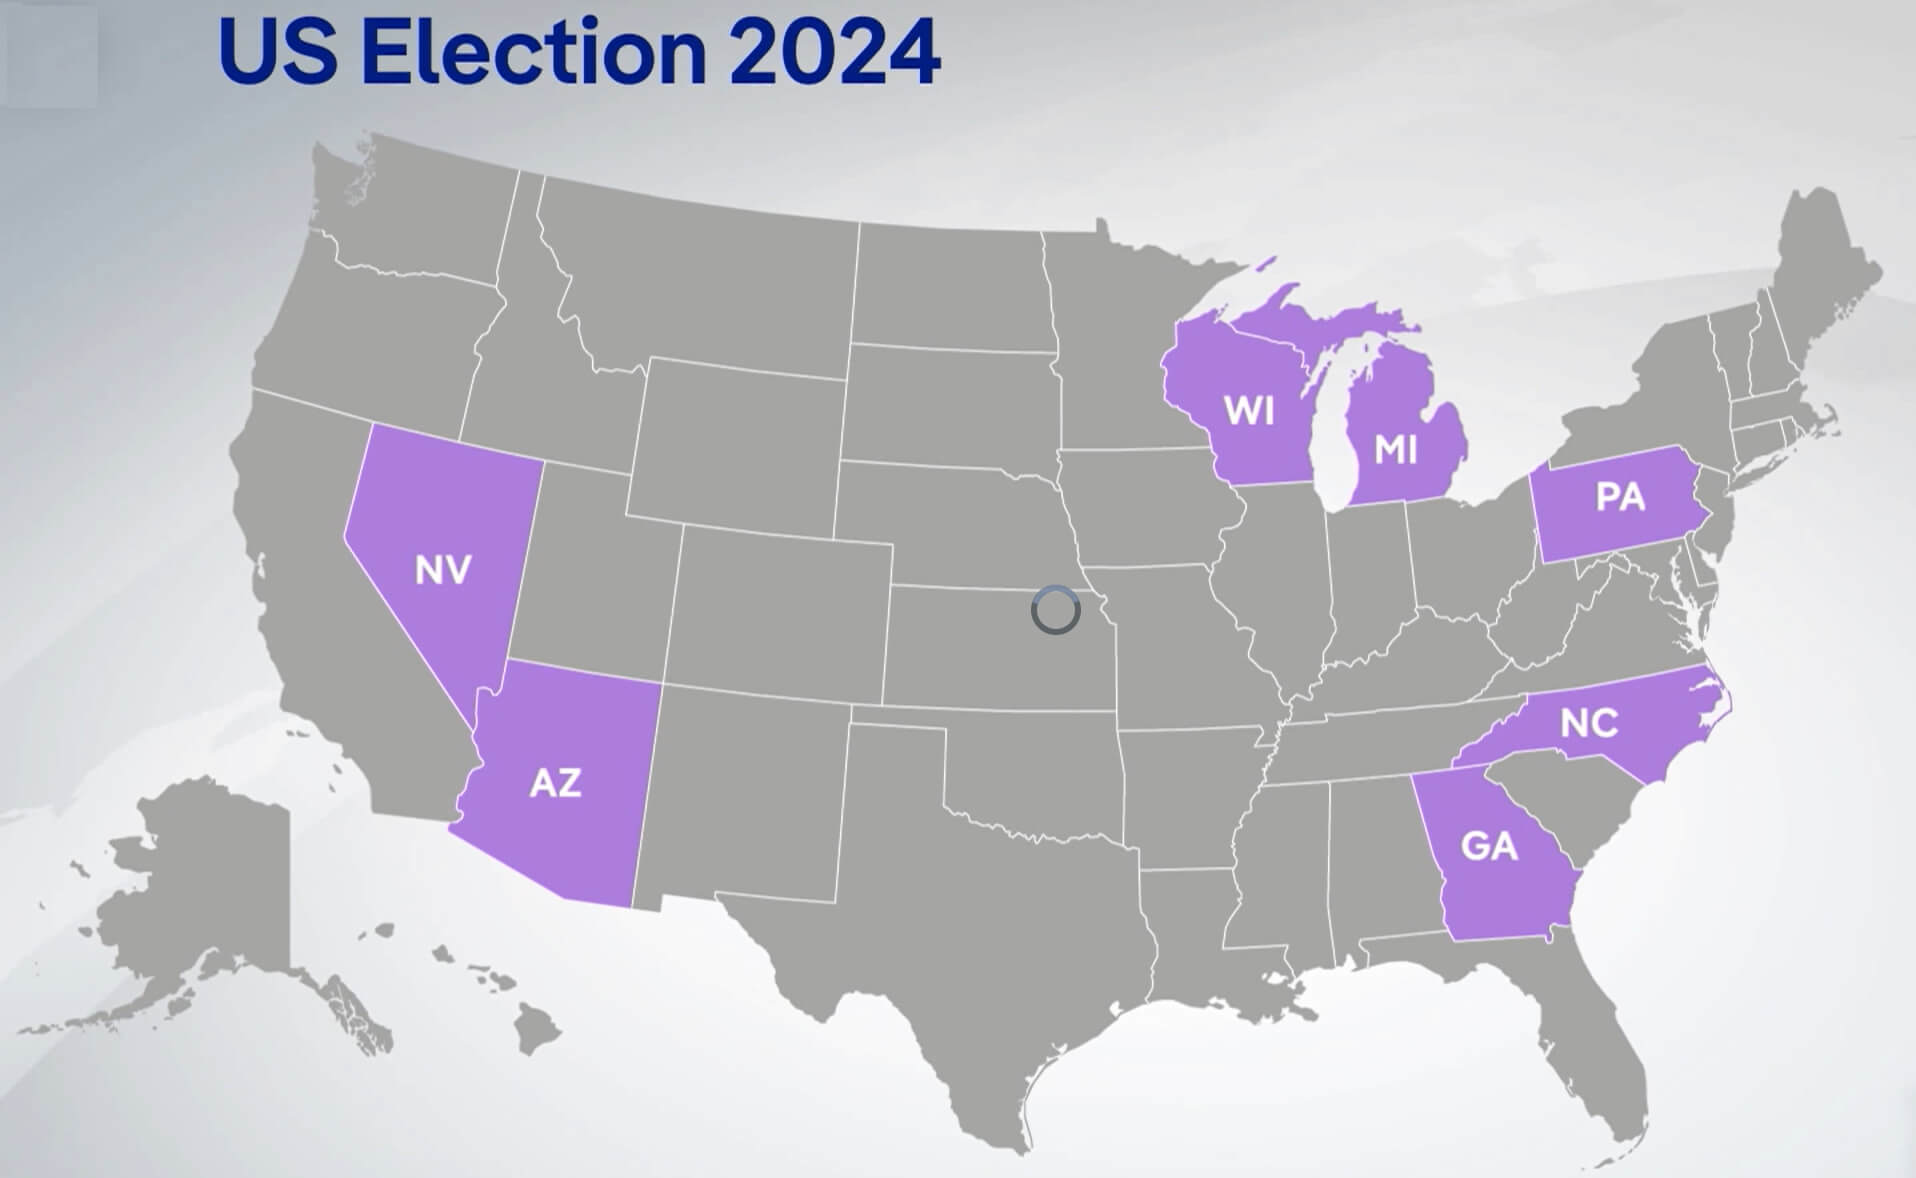 2024 U.S. Presidential Election Swing States
2020 Swing State US Election Results: Which States Sealed the Victory?
2020 U.S. Presidential Election Results In Pennsylvania
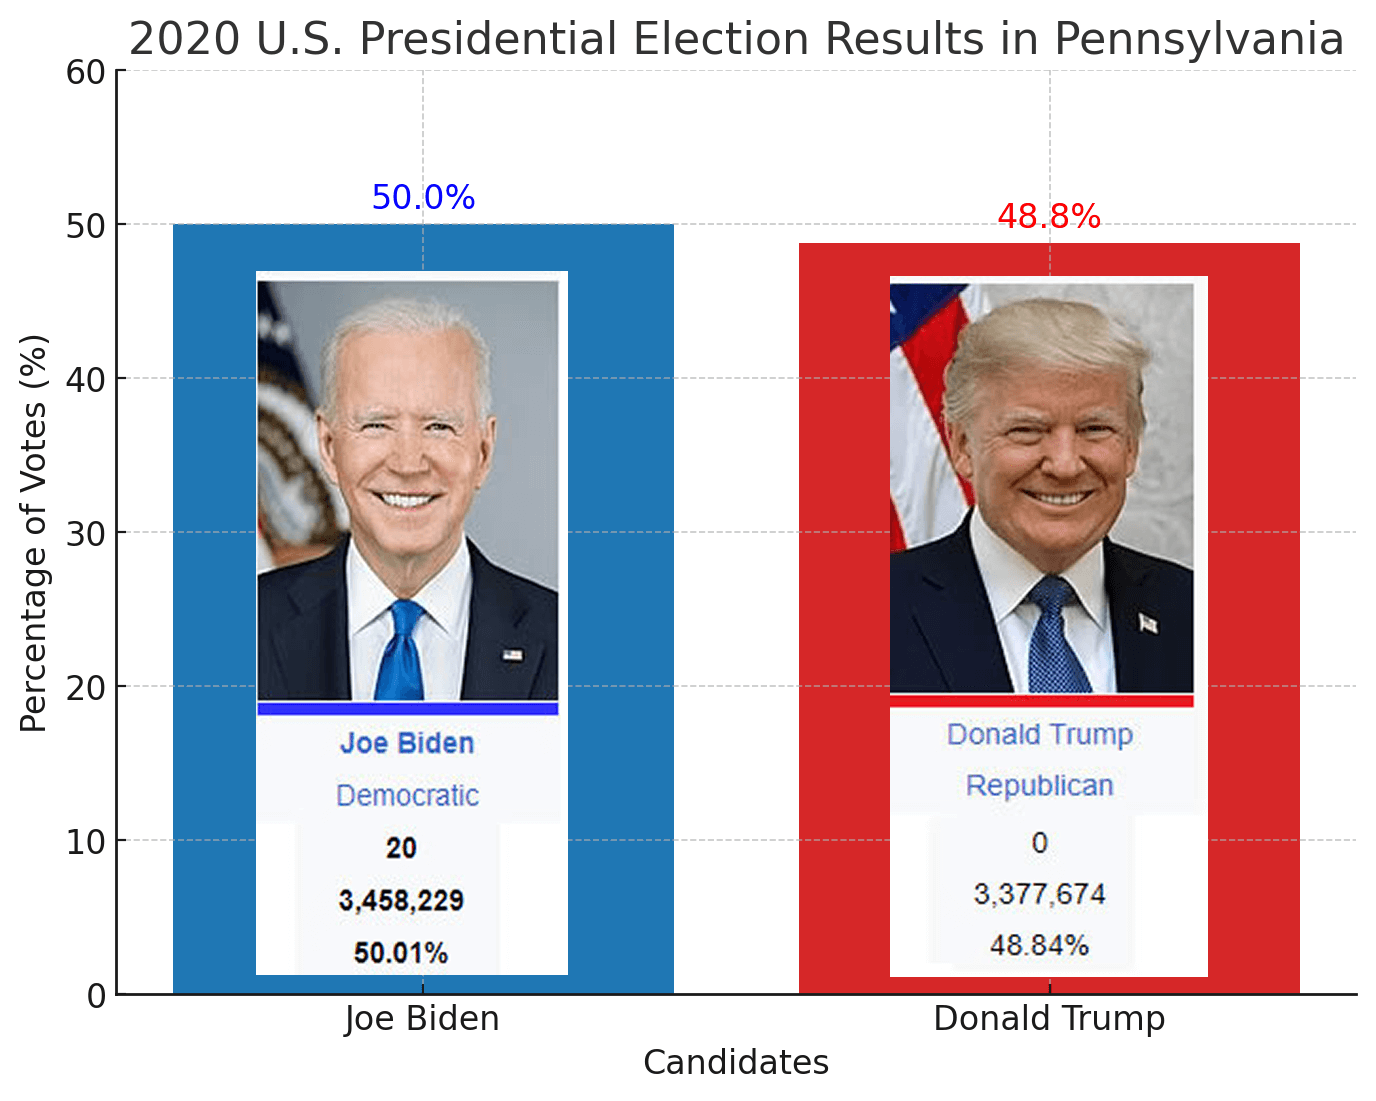 2020 U.S. Presidential Election Results In Pennsylvania
- Democratic Party: 3,458,229 votes – (50.01%) – 20 Electoral vote
- Republican Party: 3,377,674 votes – (48.84%) – 0 Electoral vote
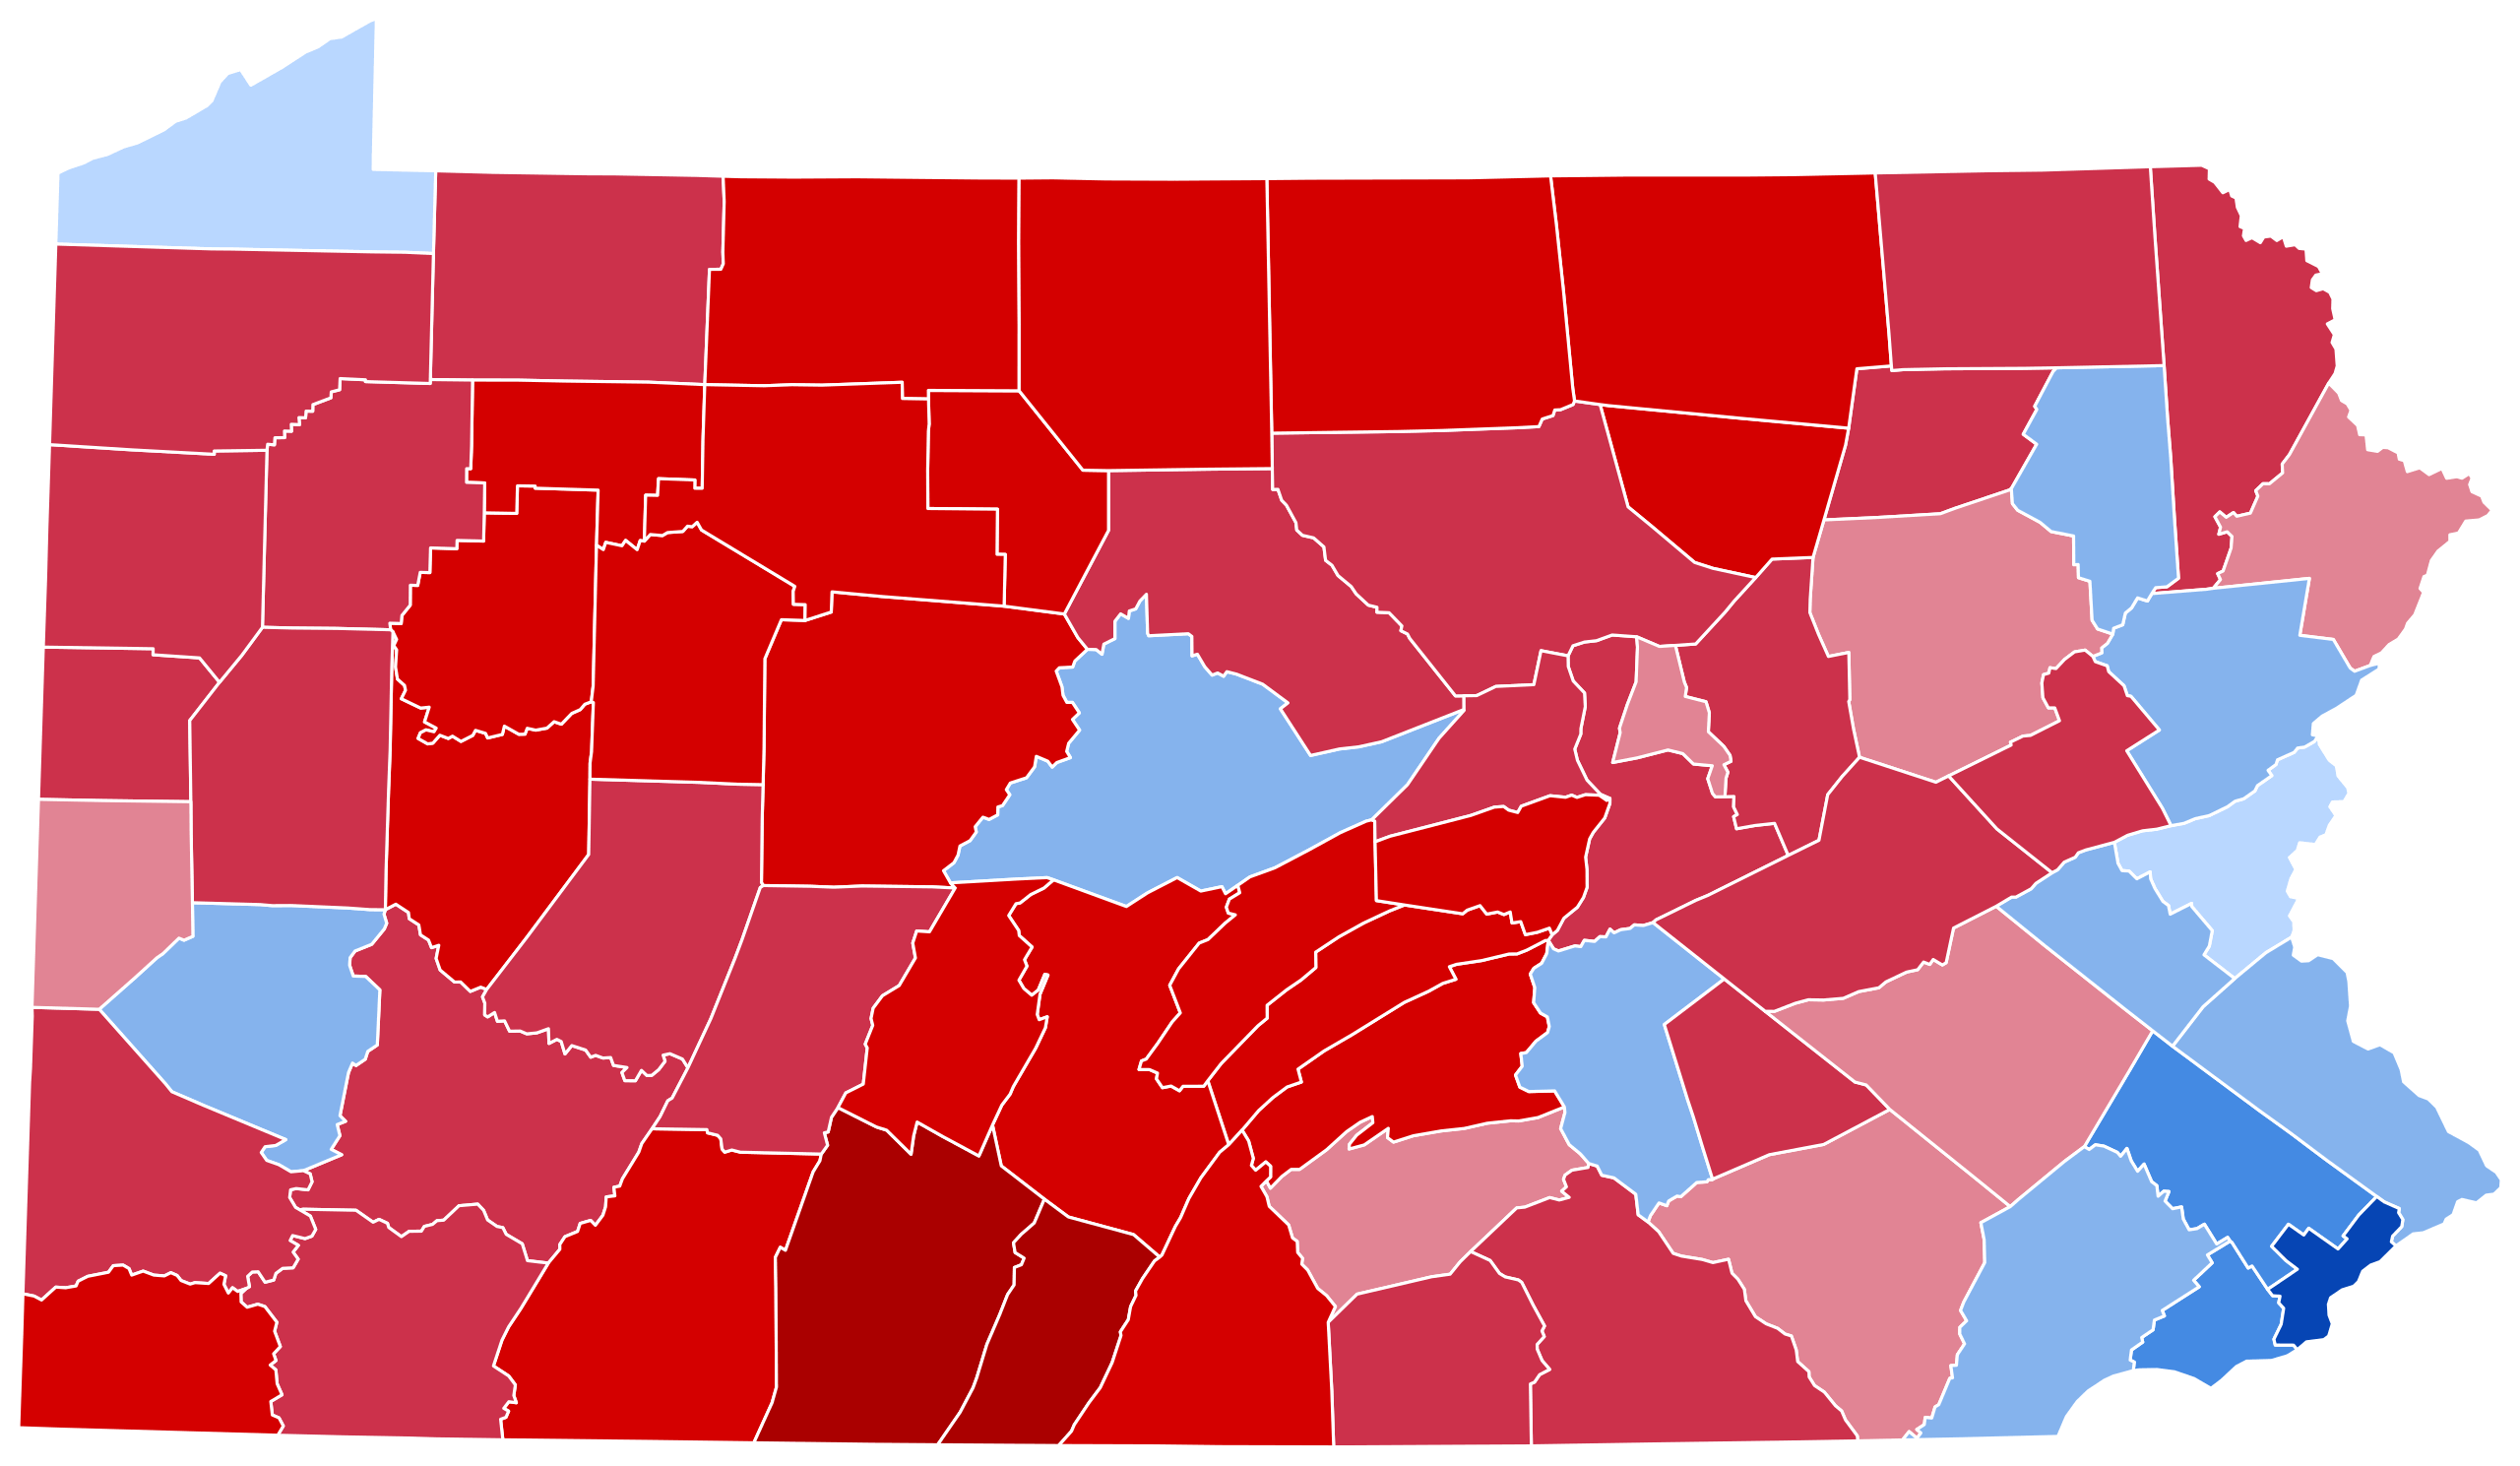
2020 United States Presidential Election in Pennsylvania by Counties Map
2020 U.S. Presidential Election Results In Michigan
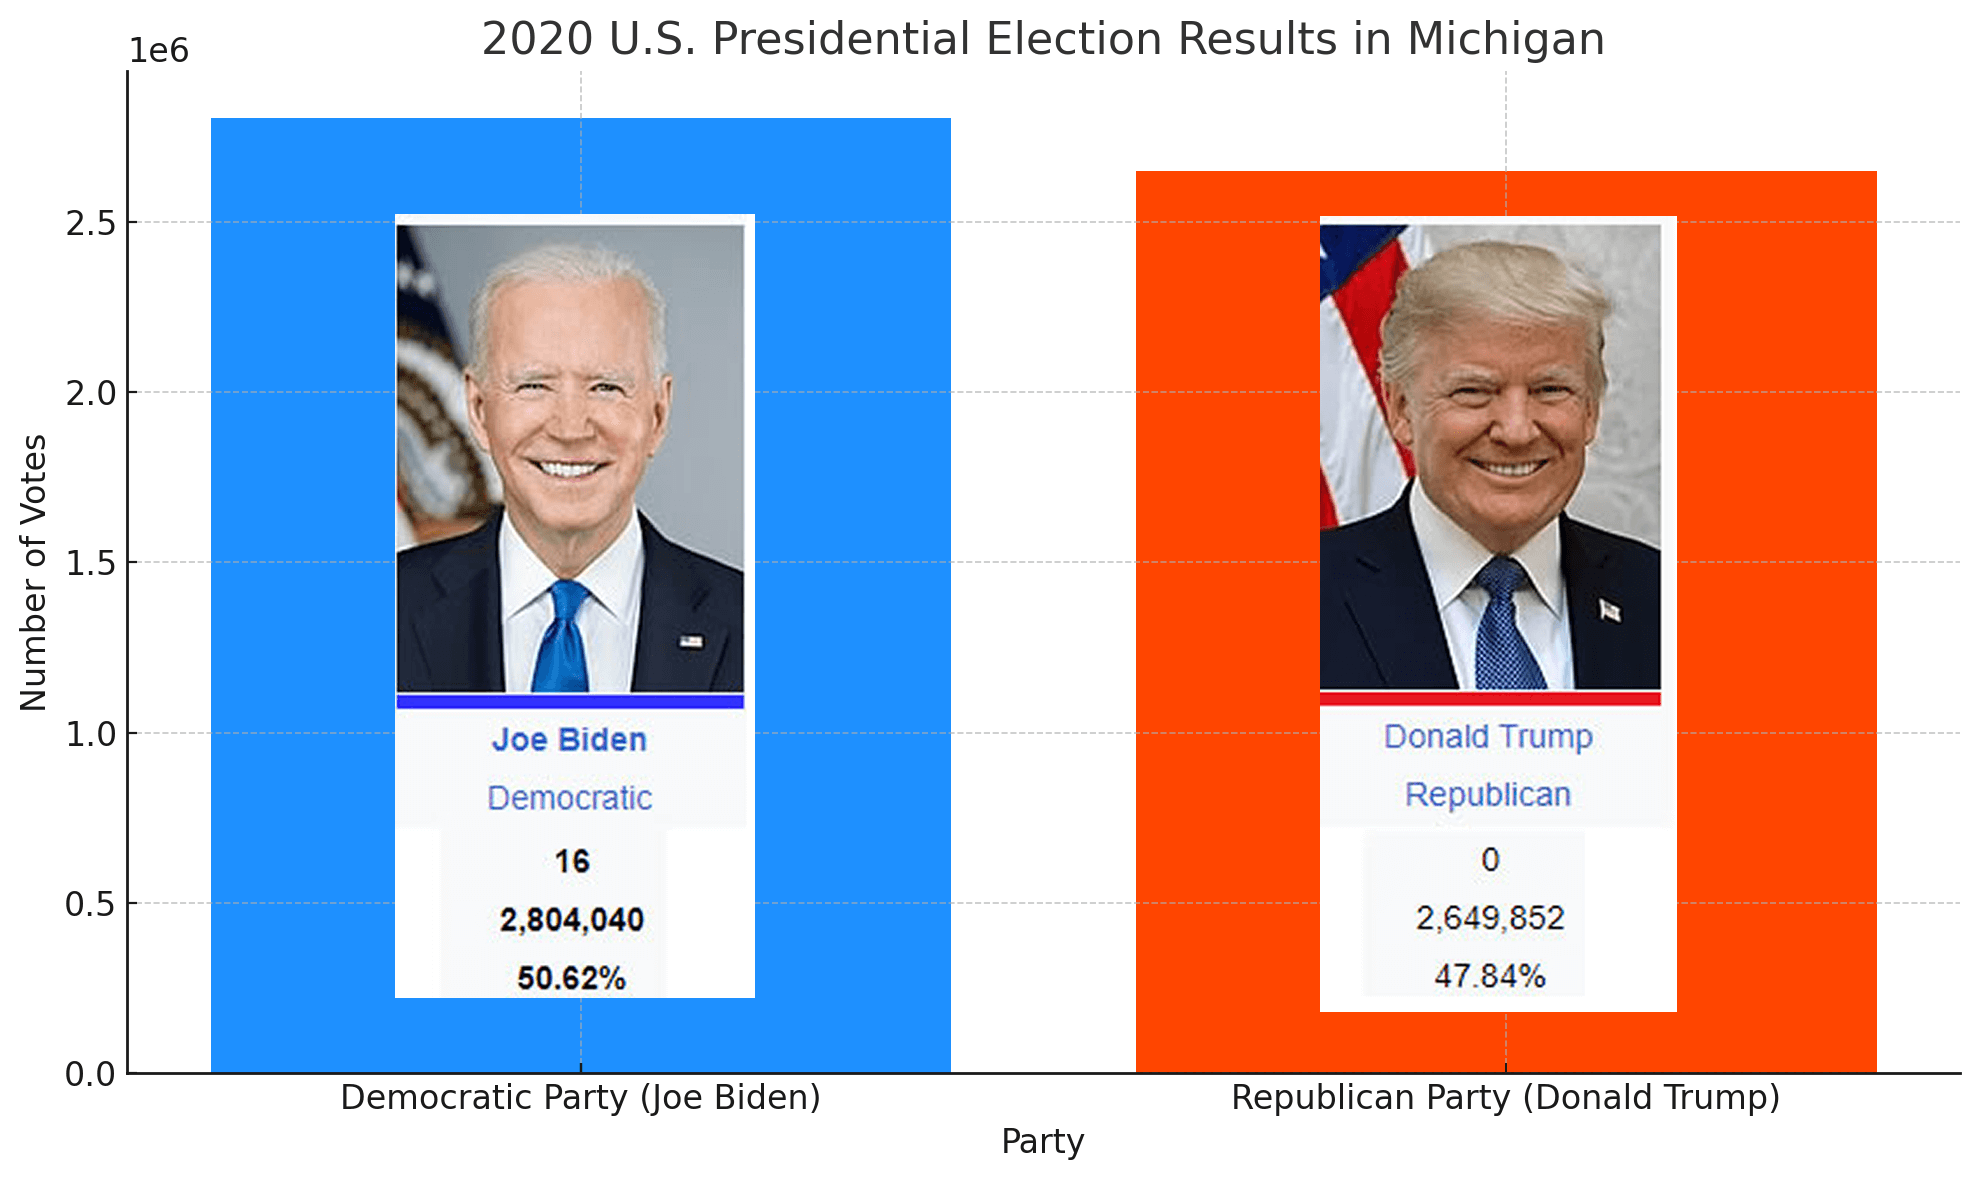 2020 U.S. Presidential Election Results In Michigan
- Democratic Party: 2,804,040 votes – (50.62%) – 16 Electoral vote
- Republican Party: 2,649,852 – (47.84%) – 0 Electoral vote
2020 United States Presidential Election in Michigan by Counties Map
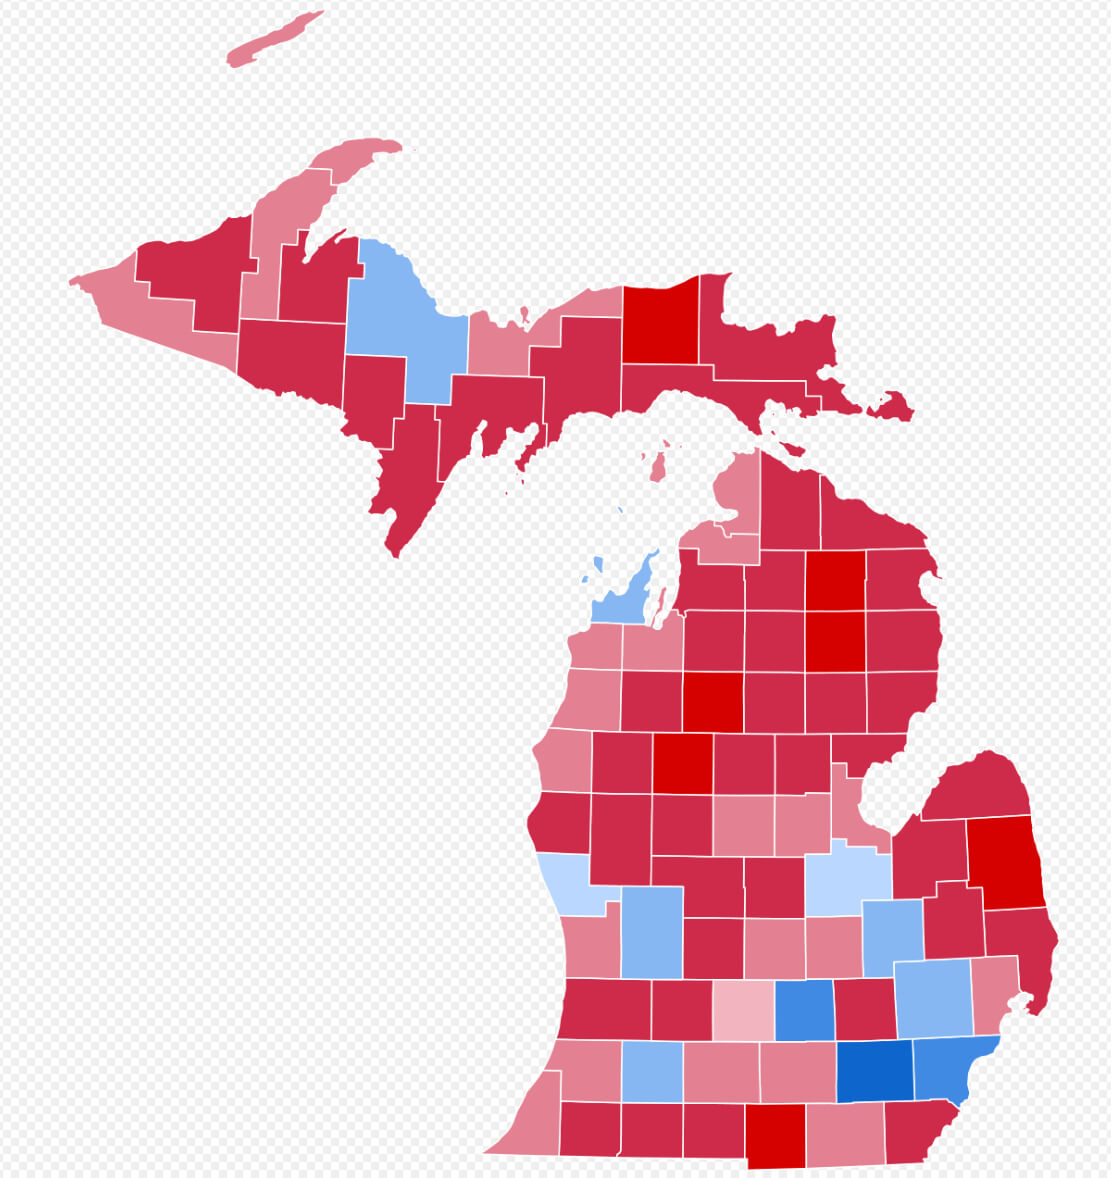 2020 US Presidential Elections in Michigan by Counties
Michigan on the Edge: 2024 US Election Predictions and the 2020 Turnaround ↗️
2020 U.S. Presidential Election Results In North Carolina
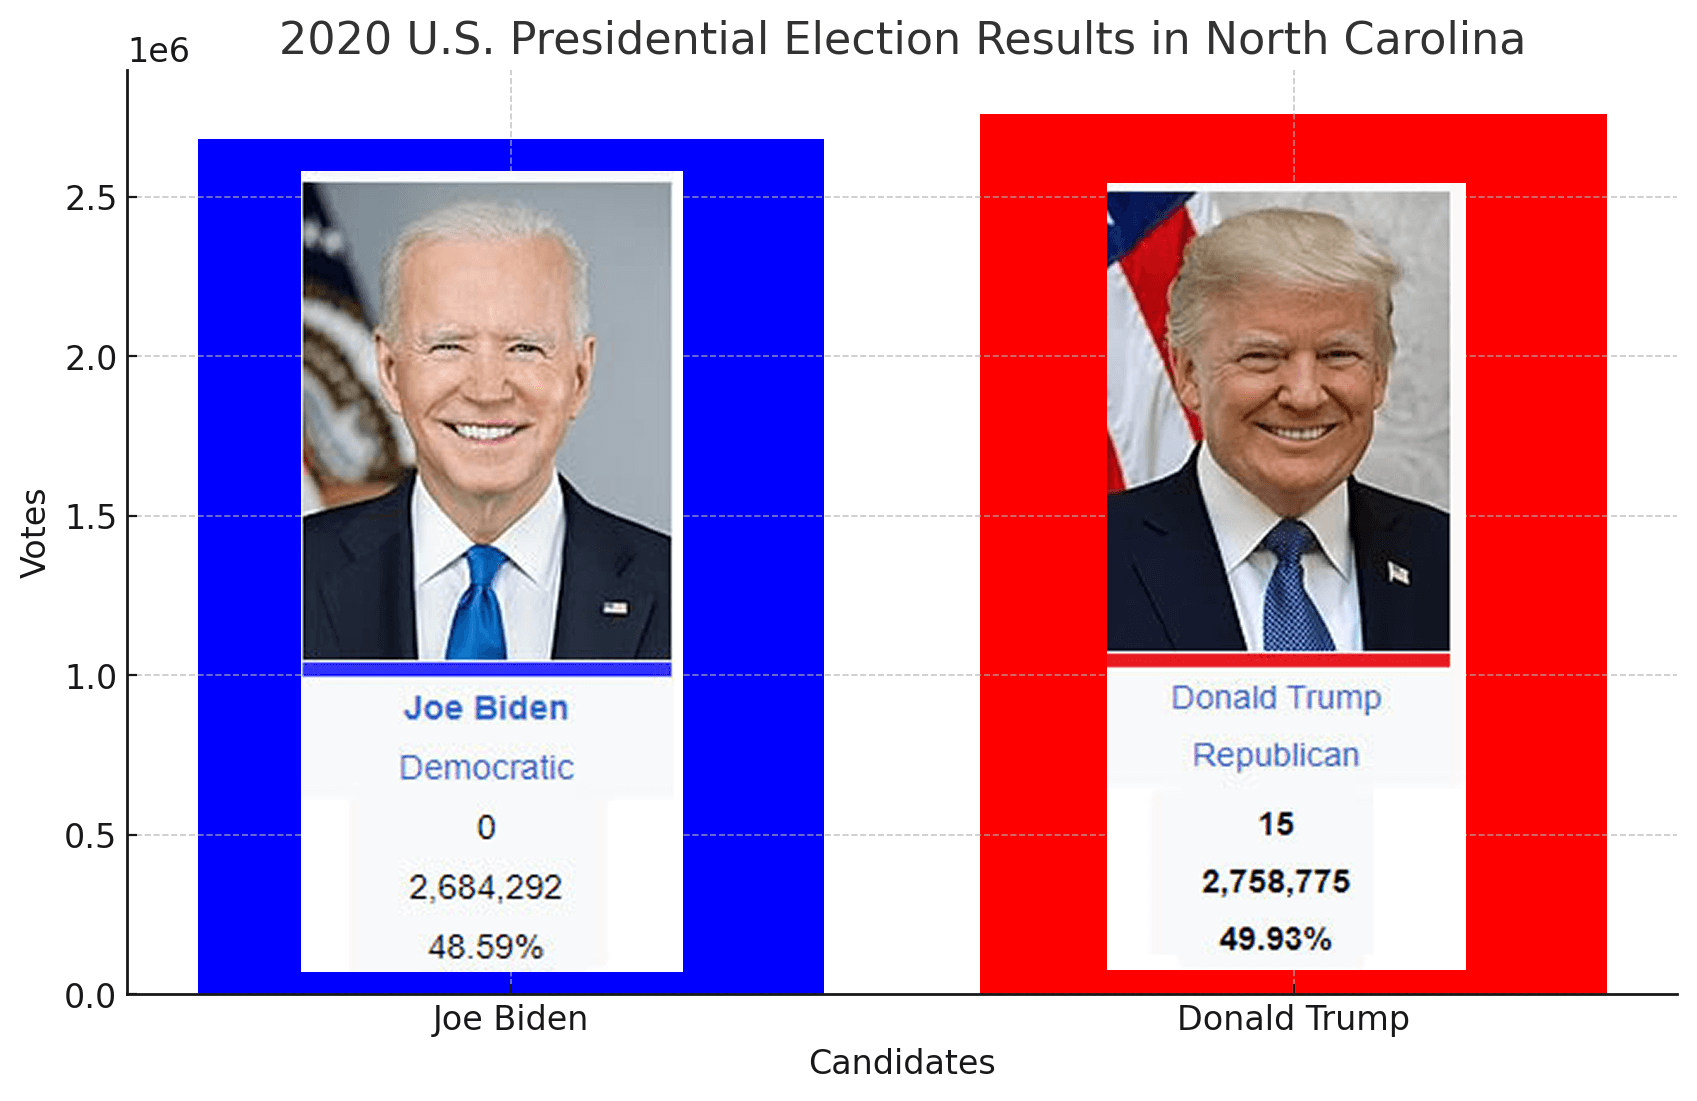
- Democratic Party: 2,682,303 votes – (48.59%) – 0 Electoral vote
- Republican Party: 2,758,775 votes – (48.84%) – 15 Electoral vote
2020 United States Presidential Election in North Carolina by Counties Map
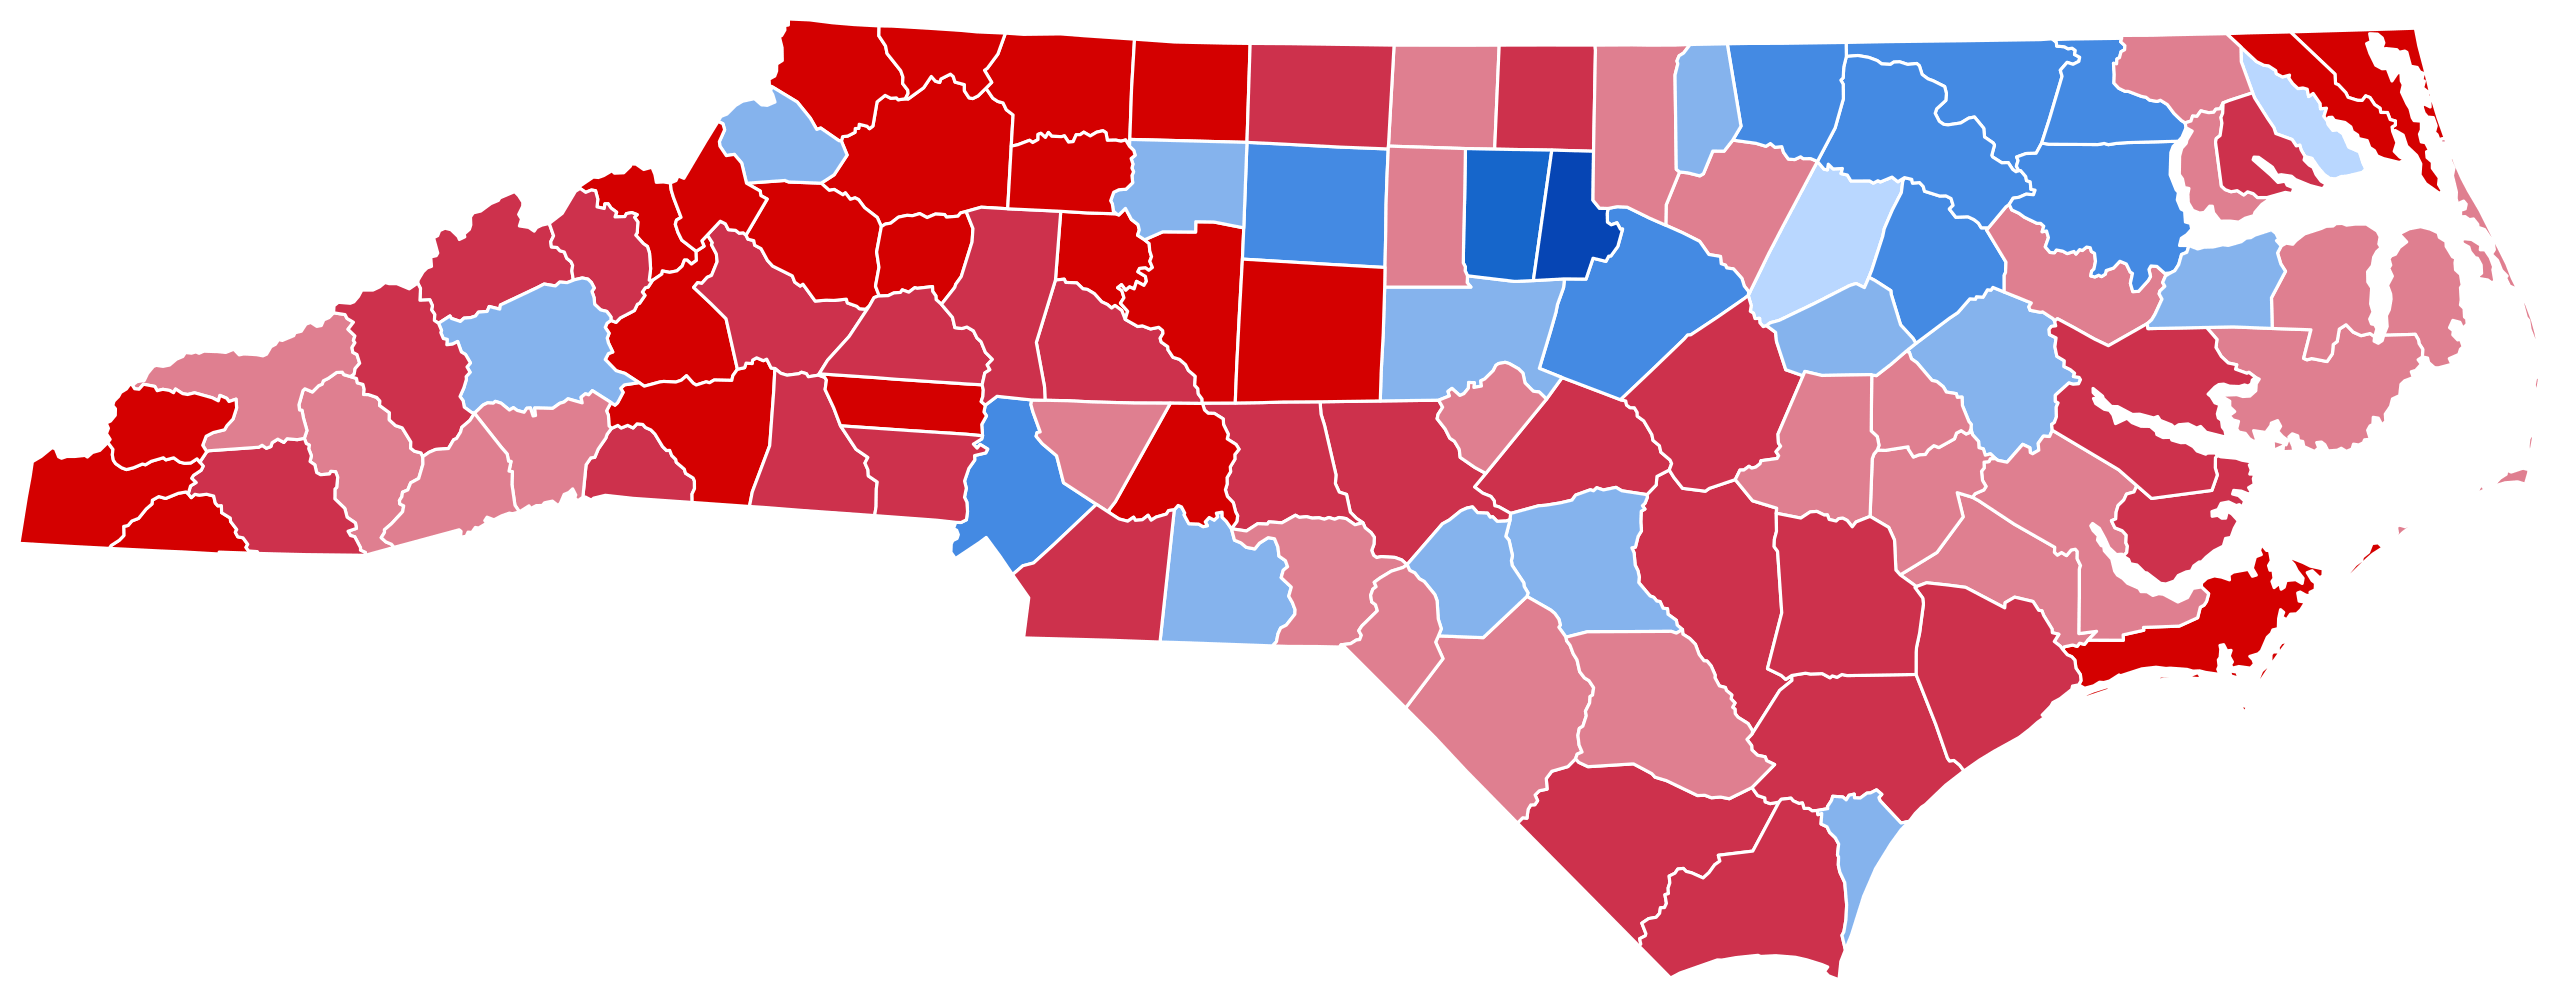 2020 US Presidential Elections in North Carolina by Counties
2020 U.S. Presidential Election Results In Georgia
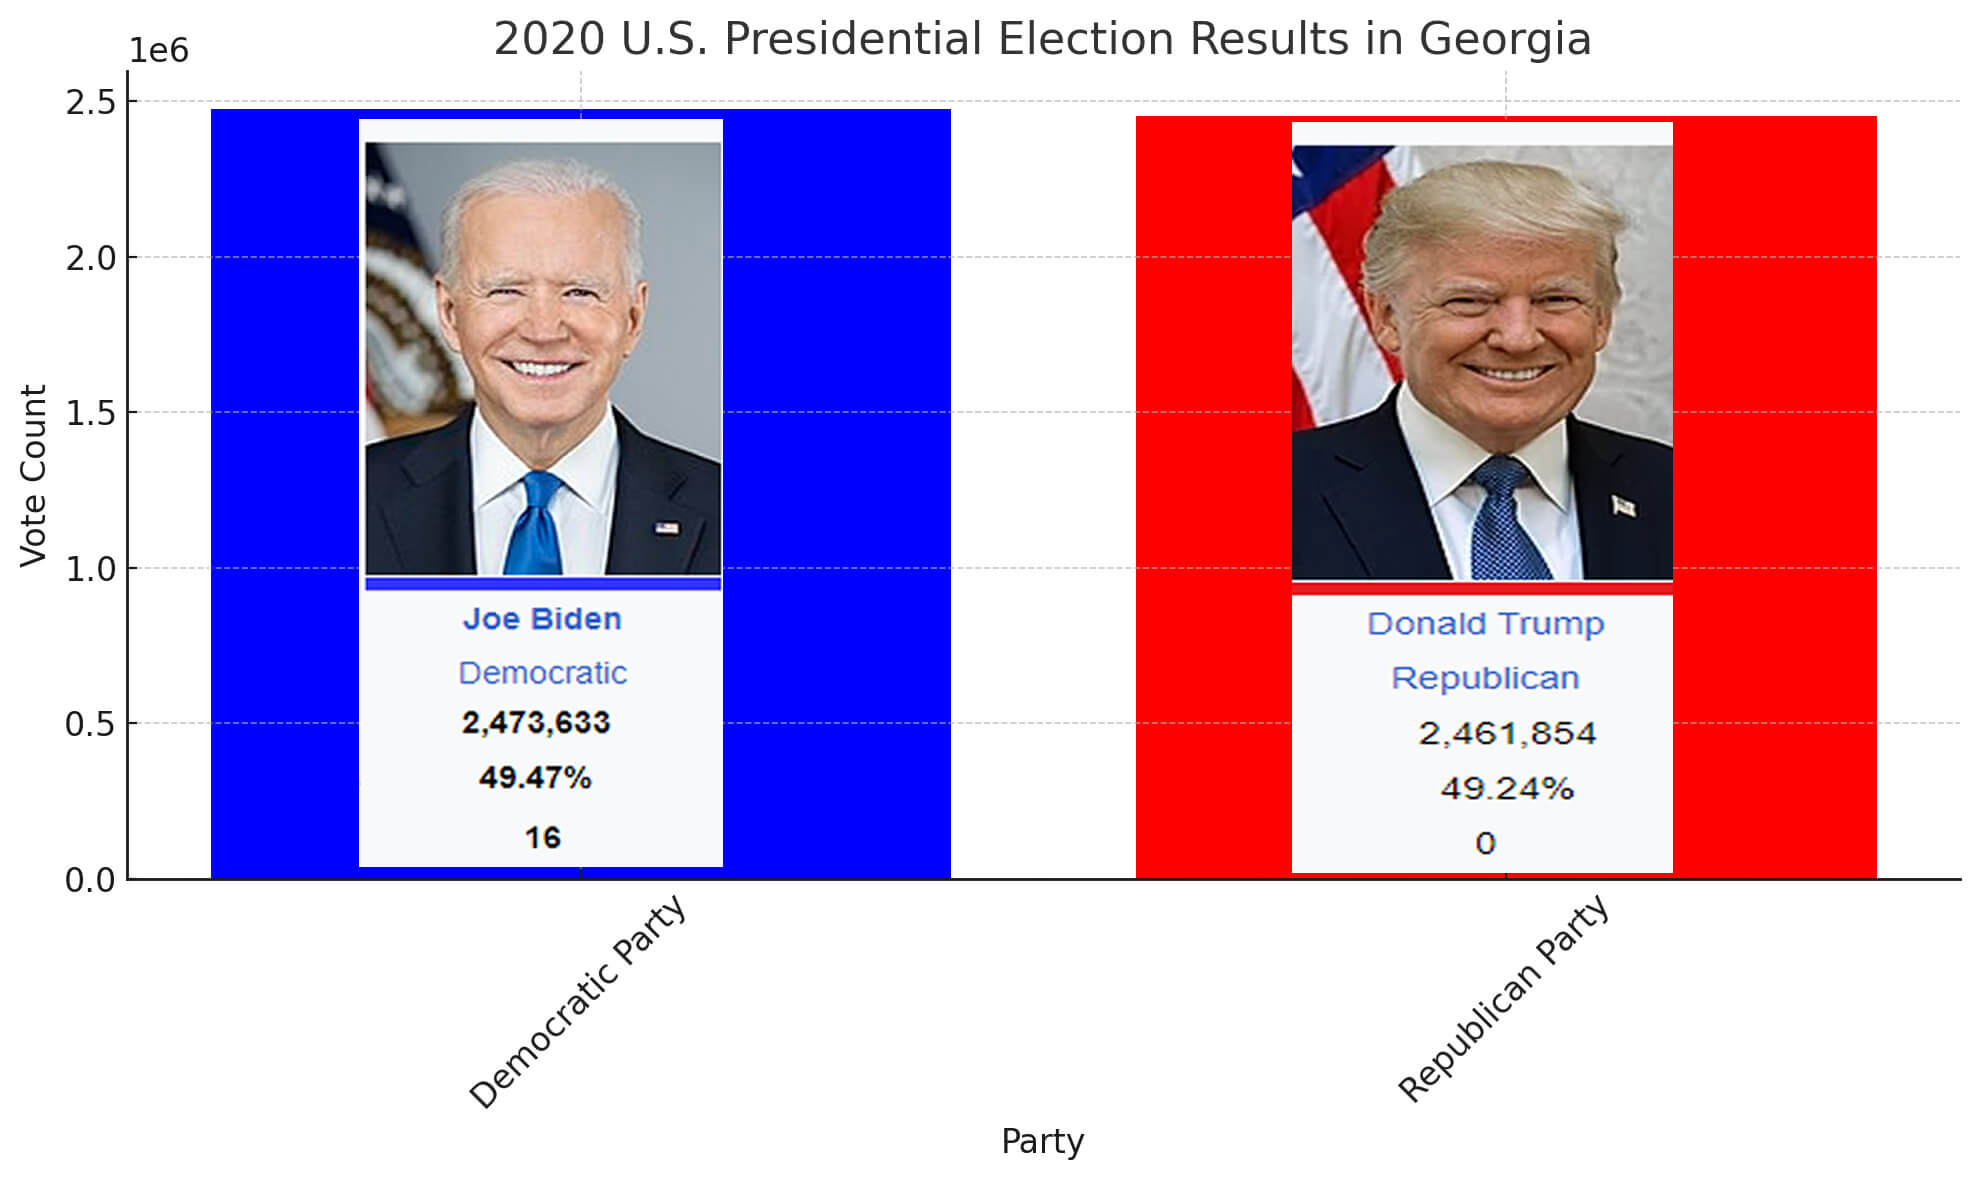 2020 U.S. Presidential Election Results In Georgia
- Democratic Party: 2,473,633 votes – (49.47%) – 16 Electoral vote
- Republican Party: 2,461,854 votes – (49.24%) – 0 Electoral vote
2020 United States Presidential Election in Georgia by Counties Map
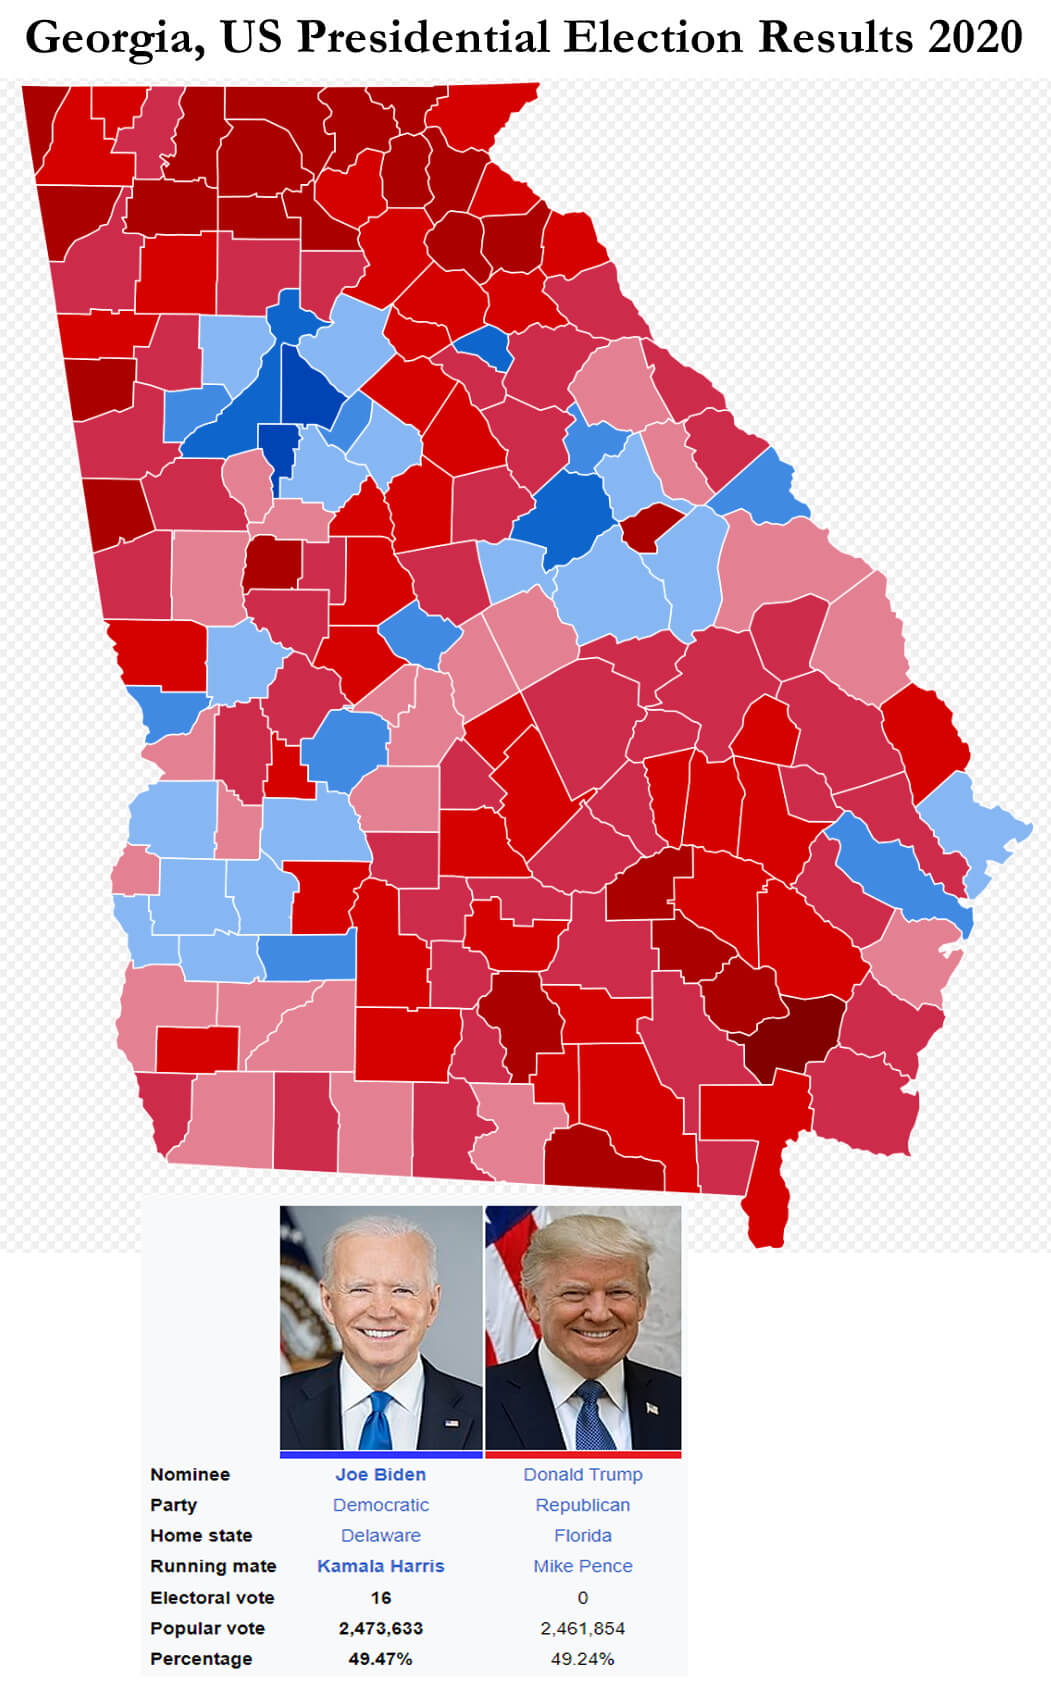 2020 US Presidential Elections in Georgia by Counties
The US presidential election in Georgia: Predictions for 2024 and a look back at the swing in 2020 ↗️
2020 U.S. Presidential Election Results In Arizona
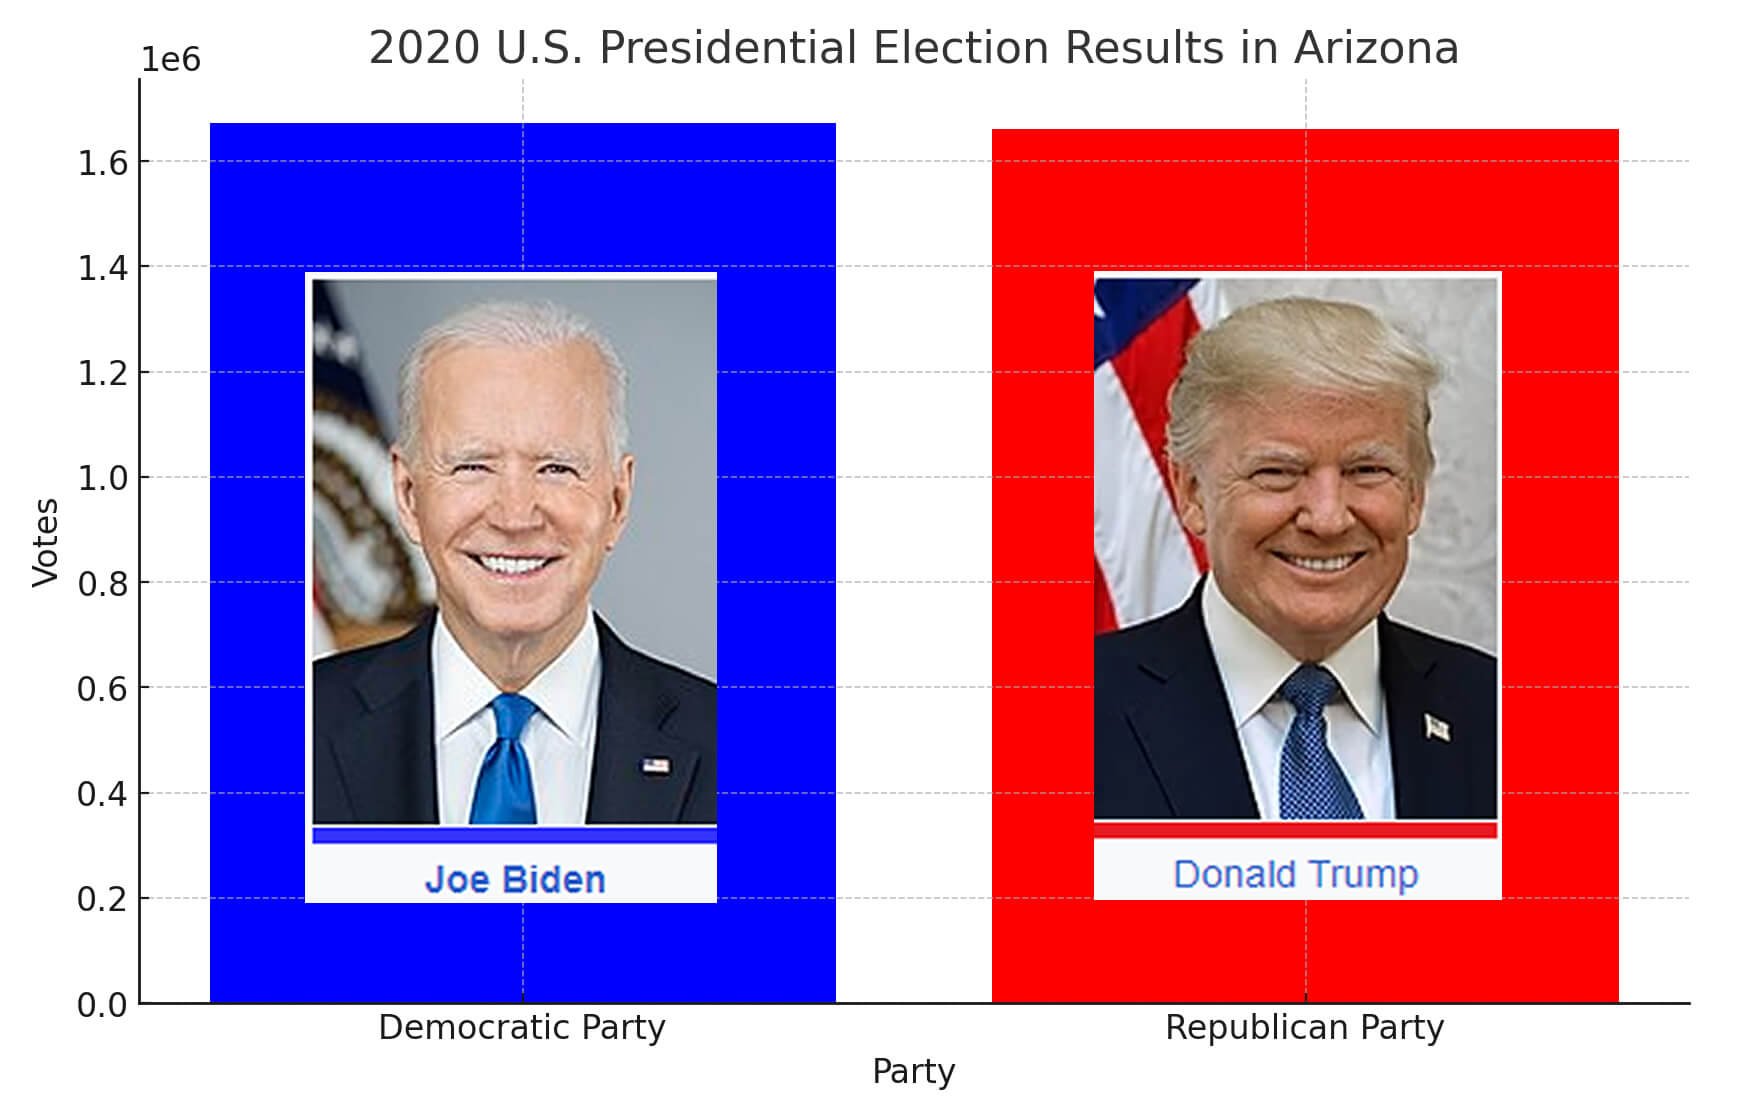
- Democratic Party: 1,672,143 votes – (49.36%) – 11 Electoral vote
- Republican Party: 1,661,686 votes – (49.06%) – 0 Electoral vote
2020 United States Presidential Election in Arizona by Counties Map
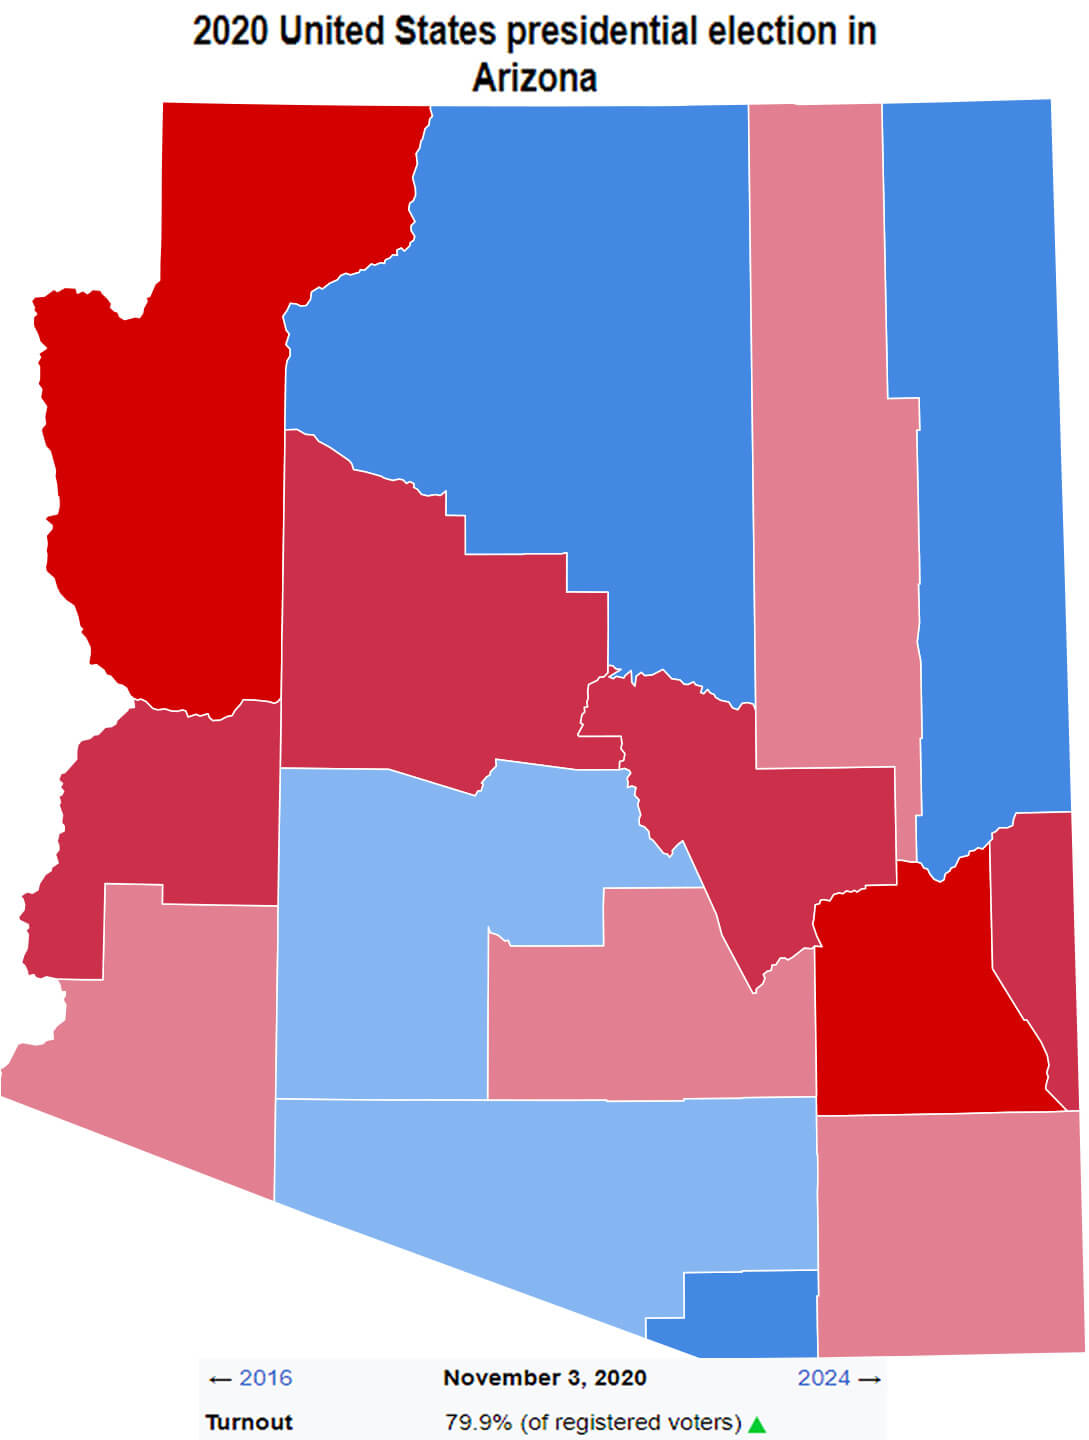 2020 US Presidential Elections in Arizona by Counties
Arizona’s US Presidential Election: 2024 Predictions and a Look Back at the 2020 Swing ↗️
2020 U.S. Presidential Election Results In Wisconsin
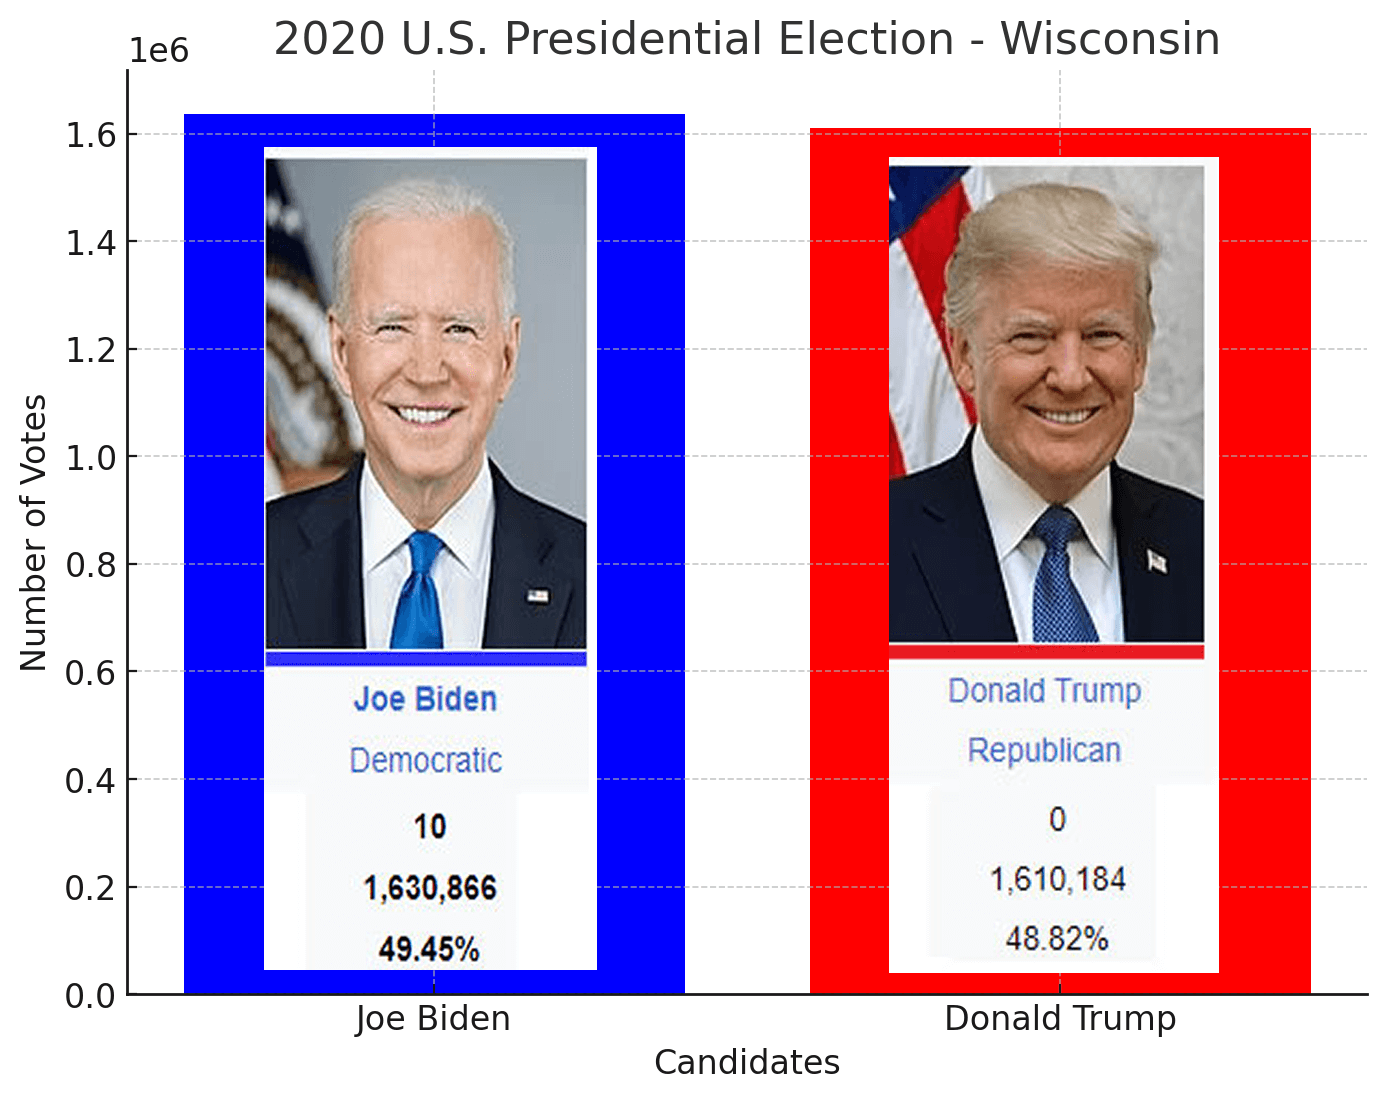 2020 U.S. Presidential Election Results In Wisconsin
- Democratic Party: 1,630,866 votes – (49.45%) – 10 Electoral vote
- Republican Party: 1,610,184 votes – (48.82%) – 0 Electoral vote
2020 United States Presidential Election in Wisconsin by Counties Map
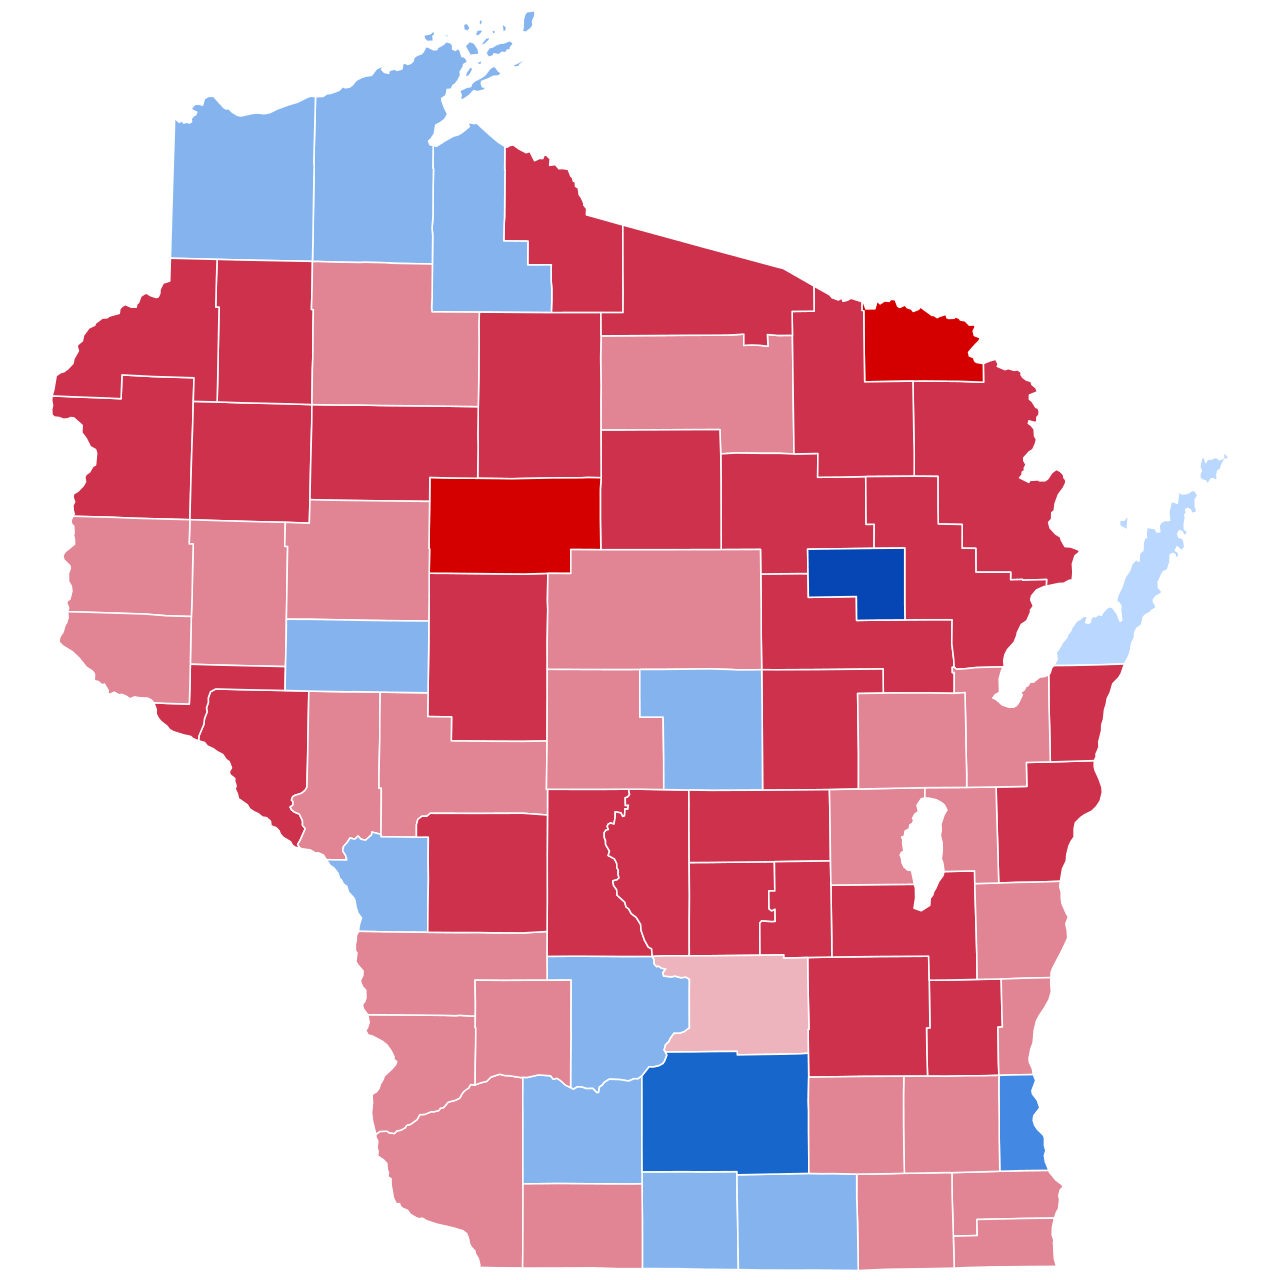 2020 US Presidential Elections in Wisconsin by Counties
2020 U.S. Presidential Election Results In Nevada
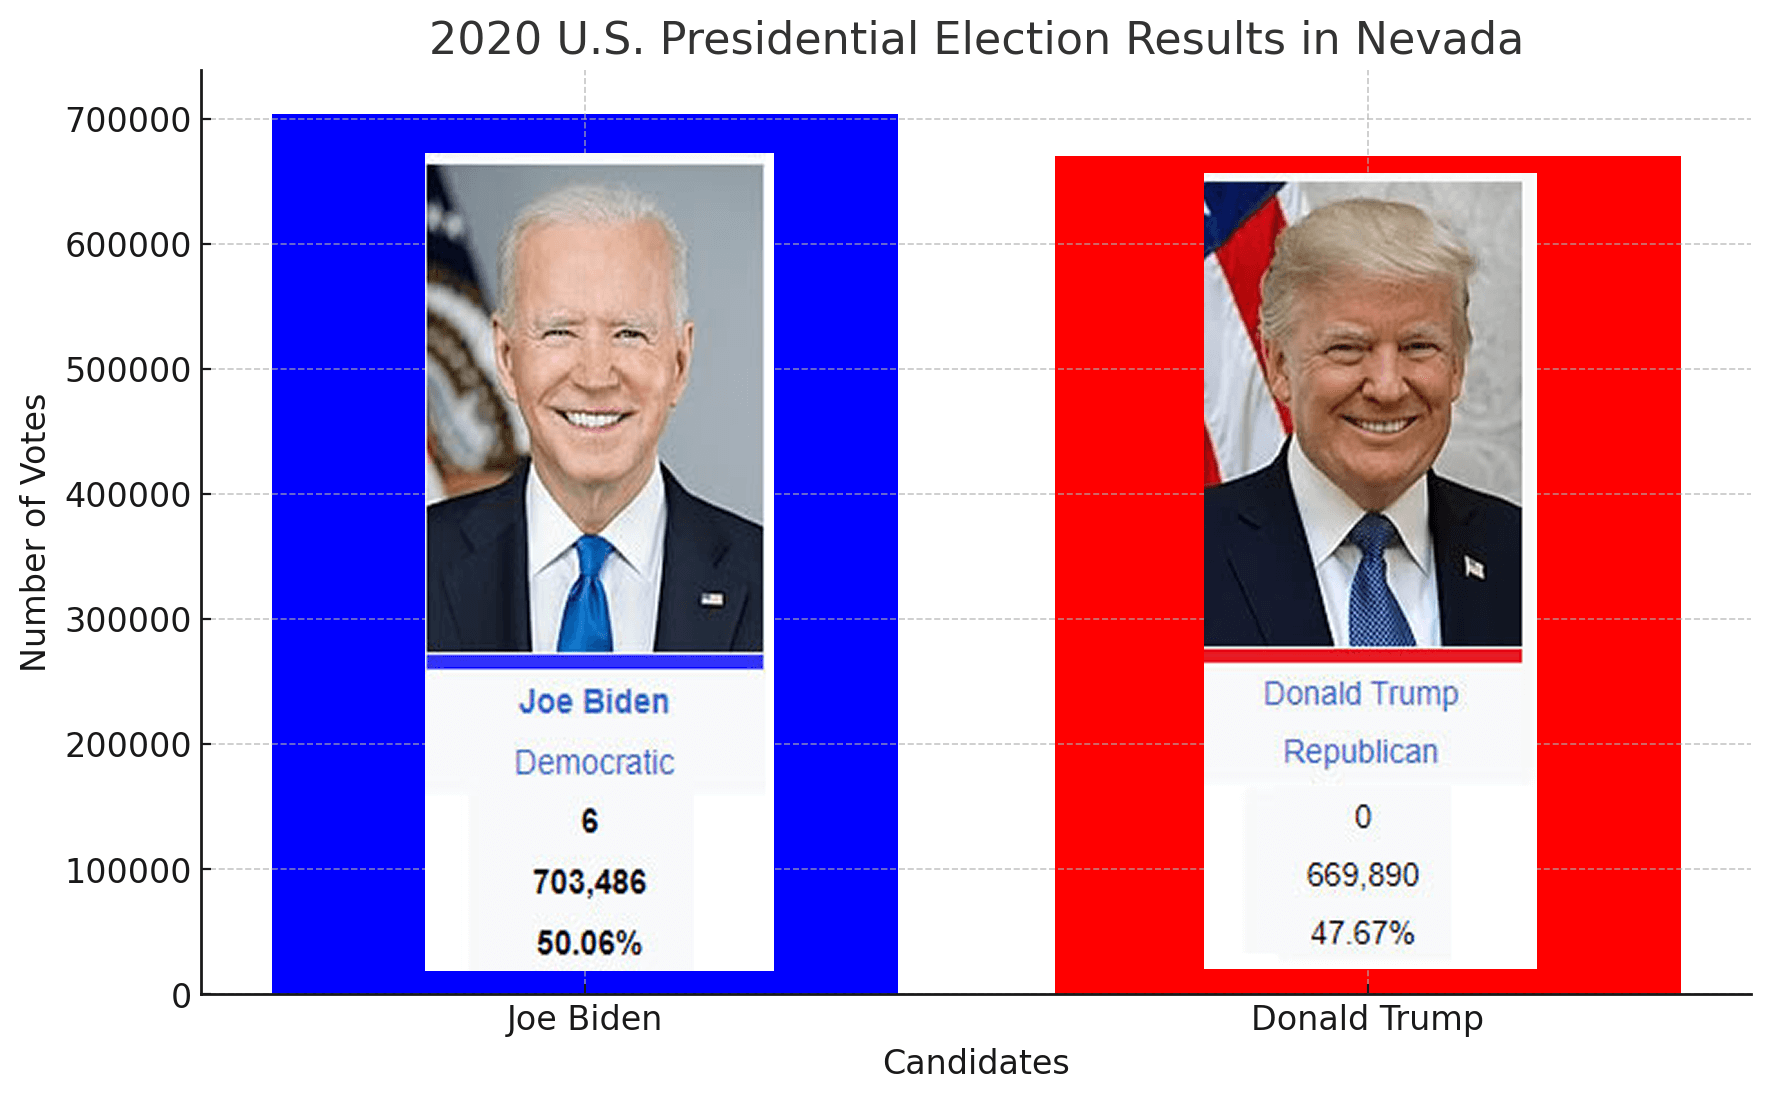 2020 U.S. Presidential Election Results In Nevada
- Democratic Party: 703,486 votes – (50.06%) – 6 Electoral vote
- Republican Party: 669,890 votes – 47.67% – 0 Electoral vote
2020 United States Presidential Election in Nevada by Counties Map
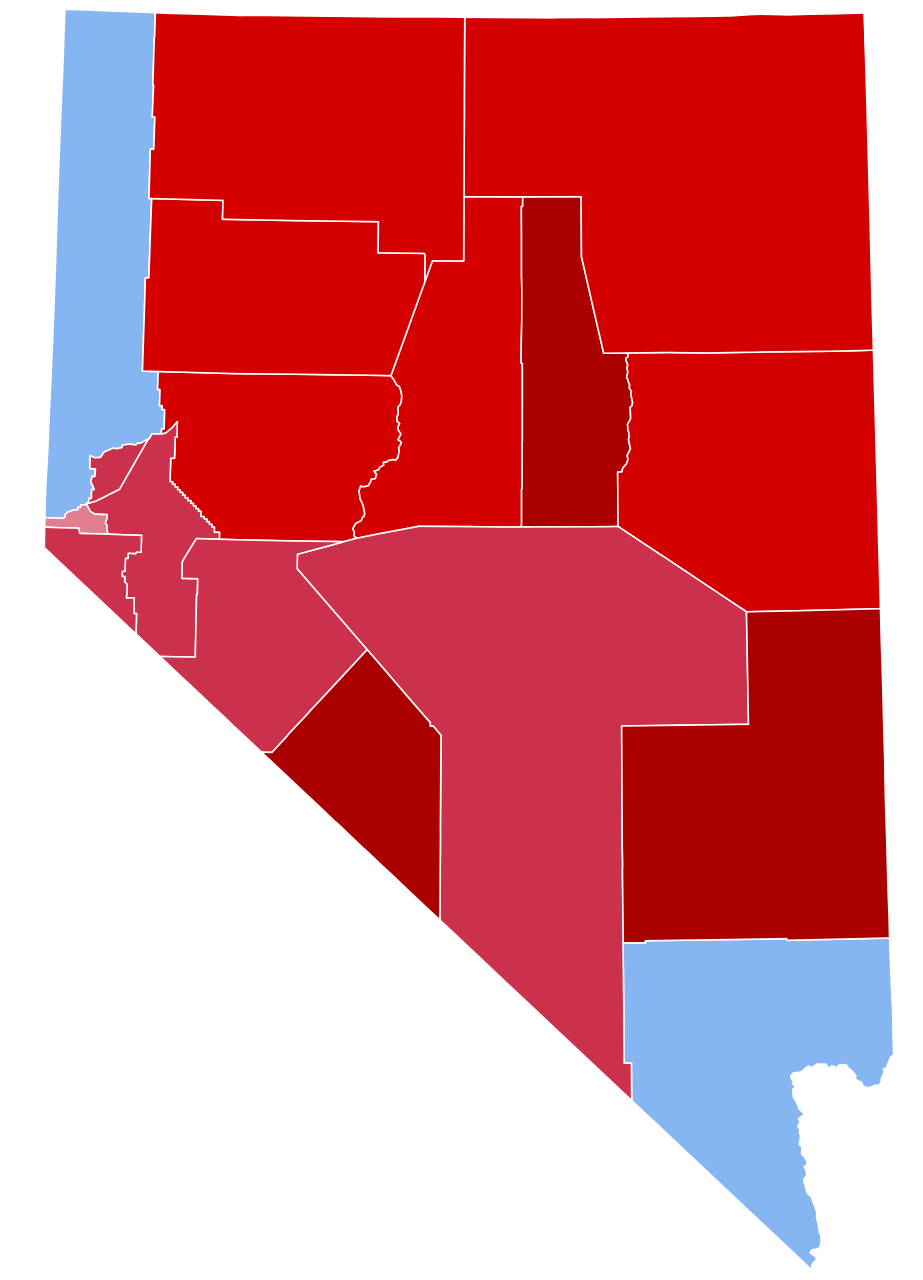 2020 US Presidential Elections in Nevada by Counties
Where is Located the US on the World Map?
Show Google interactive map, satellite map, where is the country located.
Get directions by driving, walking, bicycling, public transportation, and traveling with street view.
Feel free to explore these pages as well:
- 2024 US Presidential Election Swing States by Maps ↗️
- Michigan on the Edge: 2024 US Election Predictions and the 2020 Turnaround ↗️
- The US presidential election in Georgia: Predictions for 2024 and a look back at the swing in 2020 ↗️
- Arizona’s US Presidential Election: 2024 Predictions and a Look Back at the 2020 Swing ↗️
- United States Map ↗️
- Map of United States ↗️
- US Population Map ↗️
- Pennsylvania Map ↗️
- Georgia Map ↗️
- Michigan Map ↗️
- North Carolina Map ↗️
- Arizona Map ↗️
- Wisconsin Map ↗️
- Nevada Map ↗️
- North America Map ↗️
- Advertisement -
